
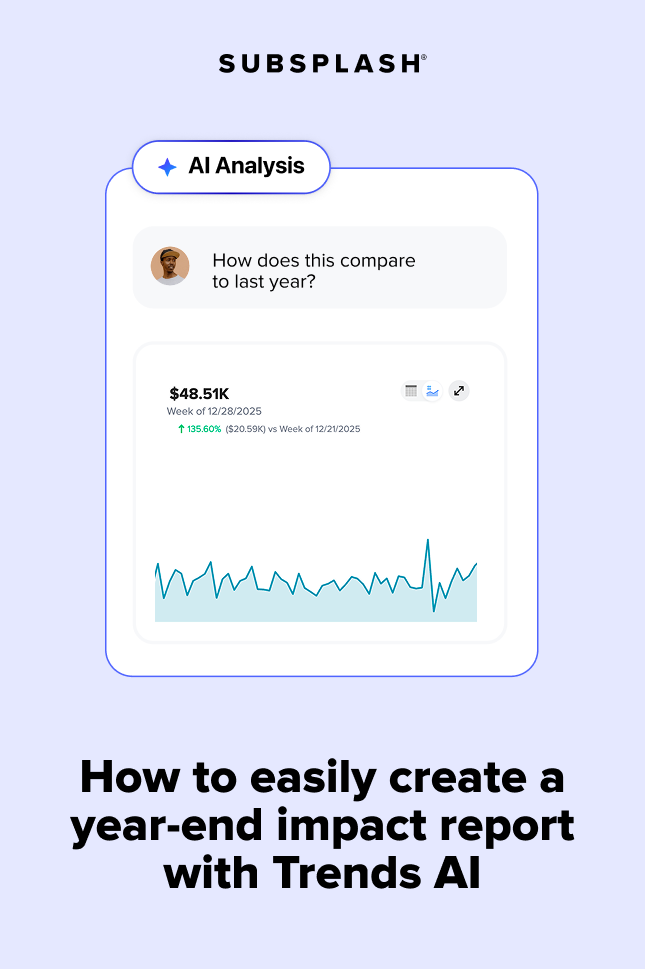


The leaves are turning, the calendars are filling up, and the end of the year will be here before we know it. Somewhere in your church office, a stack of spreadsheets is quietly growing. Year-end is coming—and with it, one of the most important documents your church will produce all year: a year-end giving report.
As your team begins financial planning for the year ahead, there are a few crucial steps to get the best success possible. Right now, if your team is pressed for time and unsure how to pull all those numbers together, there's good news: new AI tools built specifically for churches are making this process easier than ever!
Let’s take a look at what a year-end giving report is, why it matters, and how Trends AI can quickly pull your report together and show the complete impact of your church’s generosity.
Why is year-end giving so important?
Year-end giving refers to the donations churches receive in the final weeks of the calendar year, typically driven by the combination of holiday generosity and donors looking to make one last tax-deductible gift before December 31st. For churches and ministries, a year-end giving campaign is a focused effort during November and December that invites givers to support the mission through end-of-year contributions.
The numbers back up just how significant this season really is: Churches receive an average of 30% of their annual donations in the month of December alone!
That means for many congregations, a few short weeks can determine whether the year ends in a surplus or a shortfall. Well-planned year-end giving campaigns can become the financial foundation for your entire ministry year, setting your church up for success year after year
And, at the heart of any year-end giving campaign is your giving report. But what is a year-end giving report, what does it entail, and why does it matter?
What is a year-end giving report, and why does it matter?
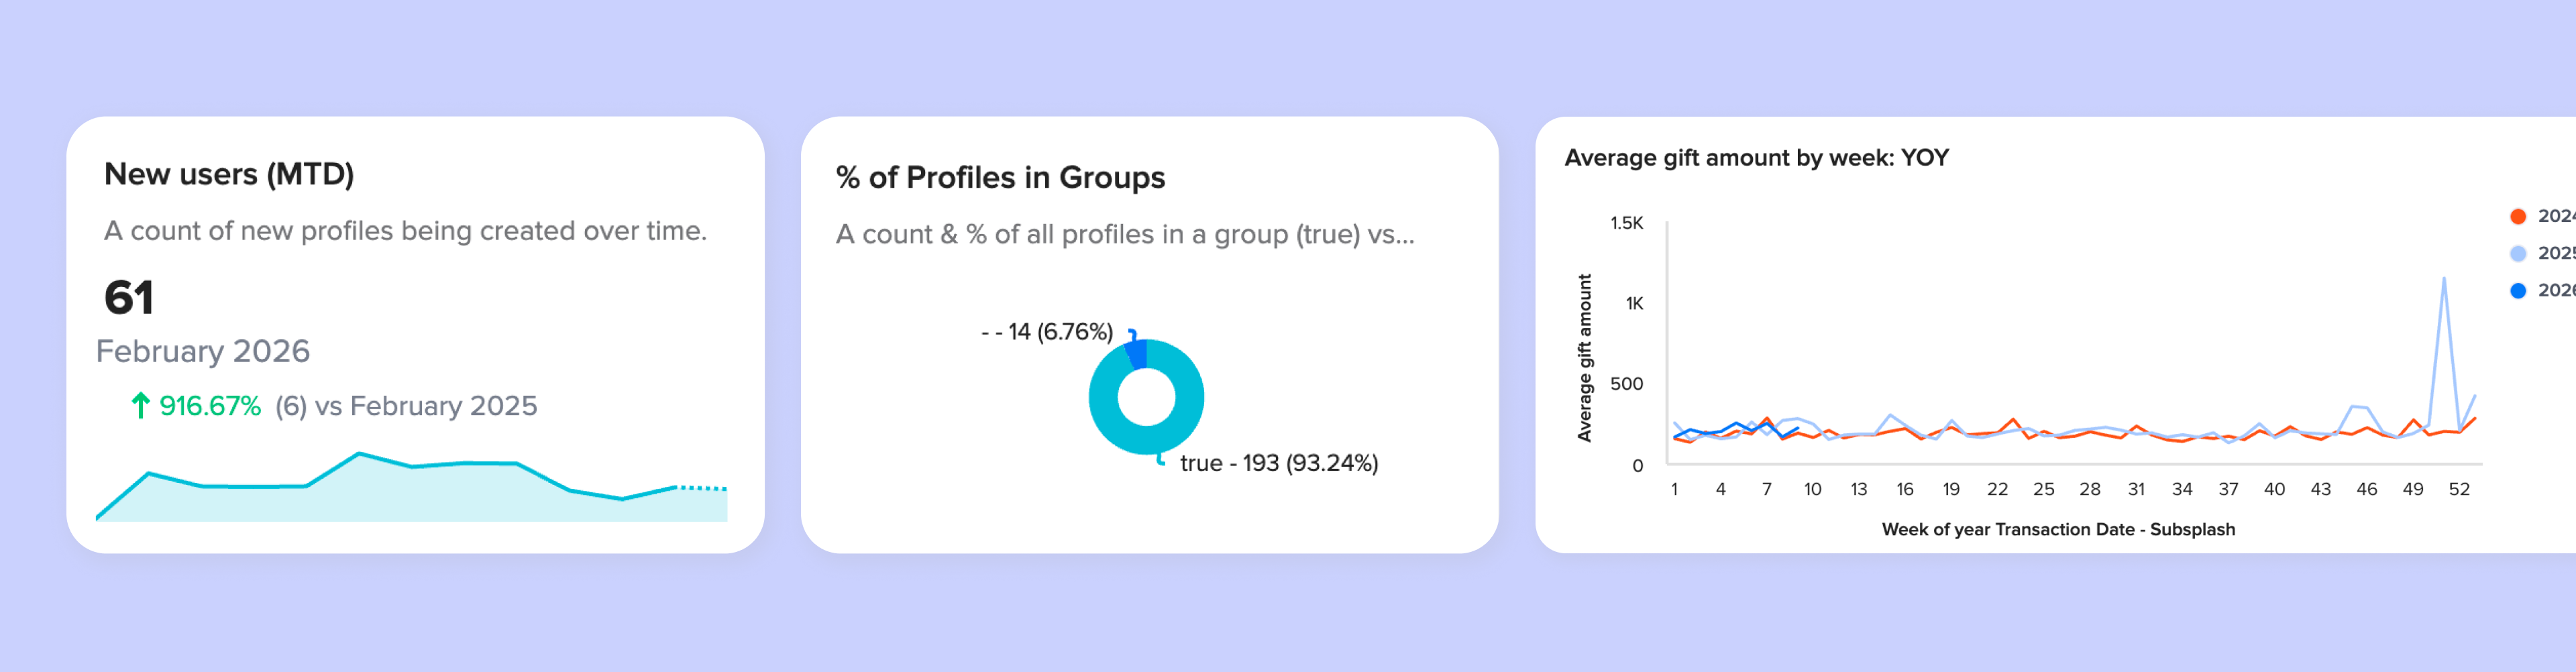
A year-end giving report (sometimes called an “impact report”) is a printed or digital summary of how your church used its tithes and offerings over the past year. It's the story behind the numbers—baptisms celebrated, meals served, missionaries sent, kids reached, communities changed, and any numbers that exemplify how your congregants’ tithes made a difference. Ideally, congregants receive a copy of this report at the end of every year.
A year-end giving impact report might be showcased via an online landing page, a printed pamphlet or bound booklet, or an interactive page online—or a combination of both! The advantage of having a digital impact report is that the link can be texted, emailed, and easily shared out with your congregation via your year-end campaign communications.
Just as church leaders don’t have to wonder where your tithes and offerings go, your donors and congregants shouldn’t either. Your year-end report provides the opportunity to paint a picture of your church’s impact with amazing numbers and powerful statistics.
An impact report should highlight things like:
- A children's playground funded and built
- School outreach events
- A new food pantry for families in need
- Number of first time visitors
- Baptism totals for the year
- Church app downloads and livestream reach
- Small group participation
- Missionaries supported at home and abroad
- College students ministered to
- … and much more!
Wherever your church made a financial investment this year, showcase those numbers to your tithers. This type of transparency builds trust with donors as well as excitement for how their hard-earned dollars are making a difference at your church.
Most importantly, make a concrete connection between donations made and Kingdom impact. Donors will love it! This will be the fuel that inspires even more generosity with your church end-of-year giving and fundraising efforts.
The challenge of gathering all that data
The problem churches run into year after year is scattered data. Attendance lives in one system, giving totals in another, and small group numbers in a spreadsheet someone updated back in June (maybe). By the time December rolls around, putting together a single, coherent picture means chasing down numbers from a dozen different places—and hoping nothing gets lost or misrepresented along the way.
It's not that churches don't want to show their impact. It's that pulling it all together has historically taken weeks of digging, searching, emailing, and cross-checking just to get the right numbers. And when so many churches wait until November or December to start gathering data and designing their report, the bottleneck happens at the worst time: during your busy holiday season!
Before you know it, the reporting process is rushed, possibly incorrect, missing important information, staff are feeling too stressed to put together a thoughtful giving campaign. Without a year-end giving strategy planned in advance, your church’s financial health can quickly stumble.
How Trends AI makes data accessible—all year long
This is exactly the gap Trends AI was built to close. Rather than treating your ministry data like a cluttered filing cabinet, Trends AI treats it like a living, breathing dashboard that's always ready, any time, whenever you need it. And at the end of the year, pulling numbers quickly and efficiently is crucial.
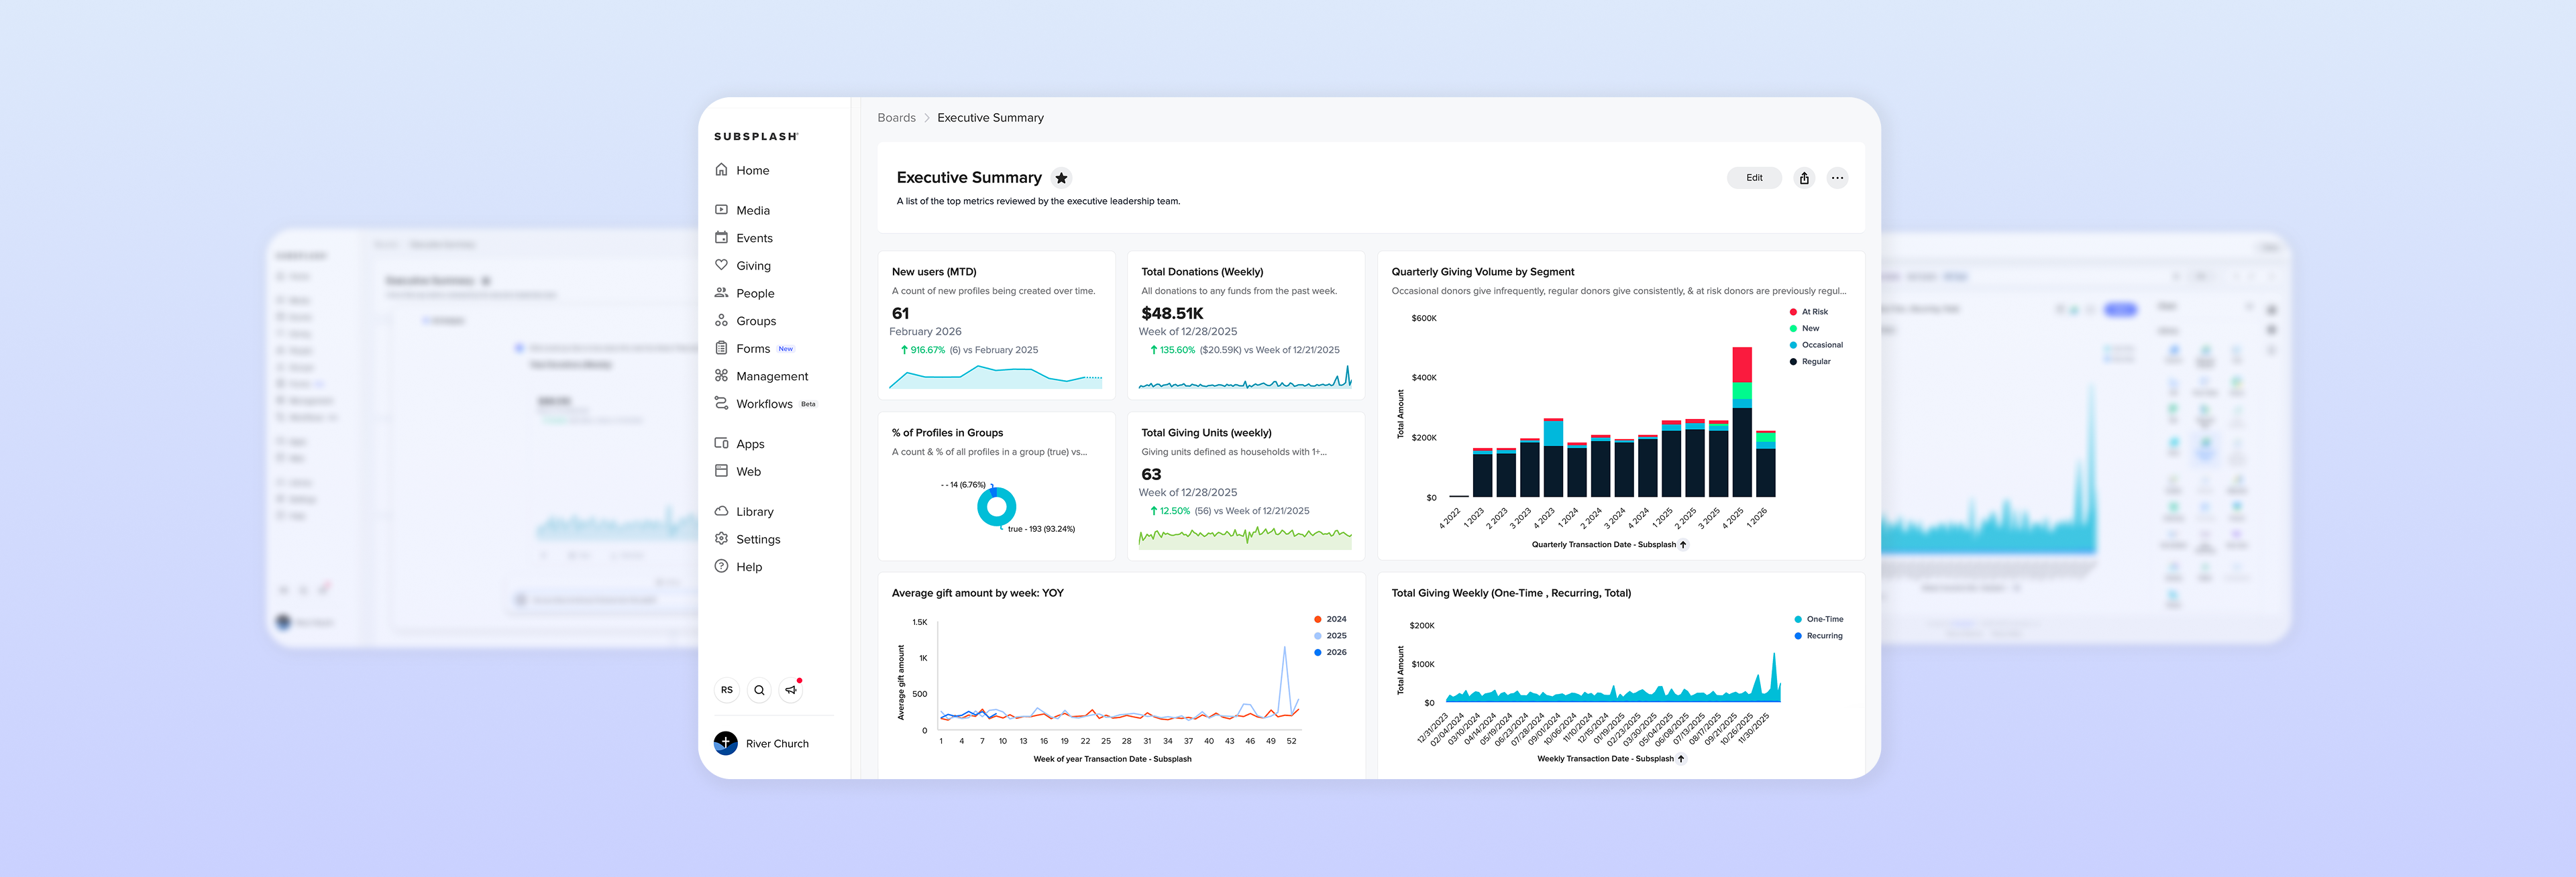
Trends AI works by pulling together giving, attendance, groups, media, campaigns, and people data from across the Subsplash platform—plus data you import from outside sources—into one unified, always-current view. Your dashboards refresh automatically every day, so there's no more re-exporting spreadsheets or hunting for a January number you thought you tracked down once already.
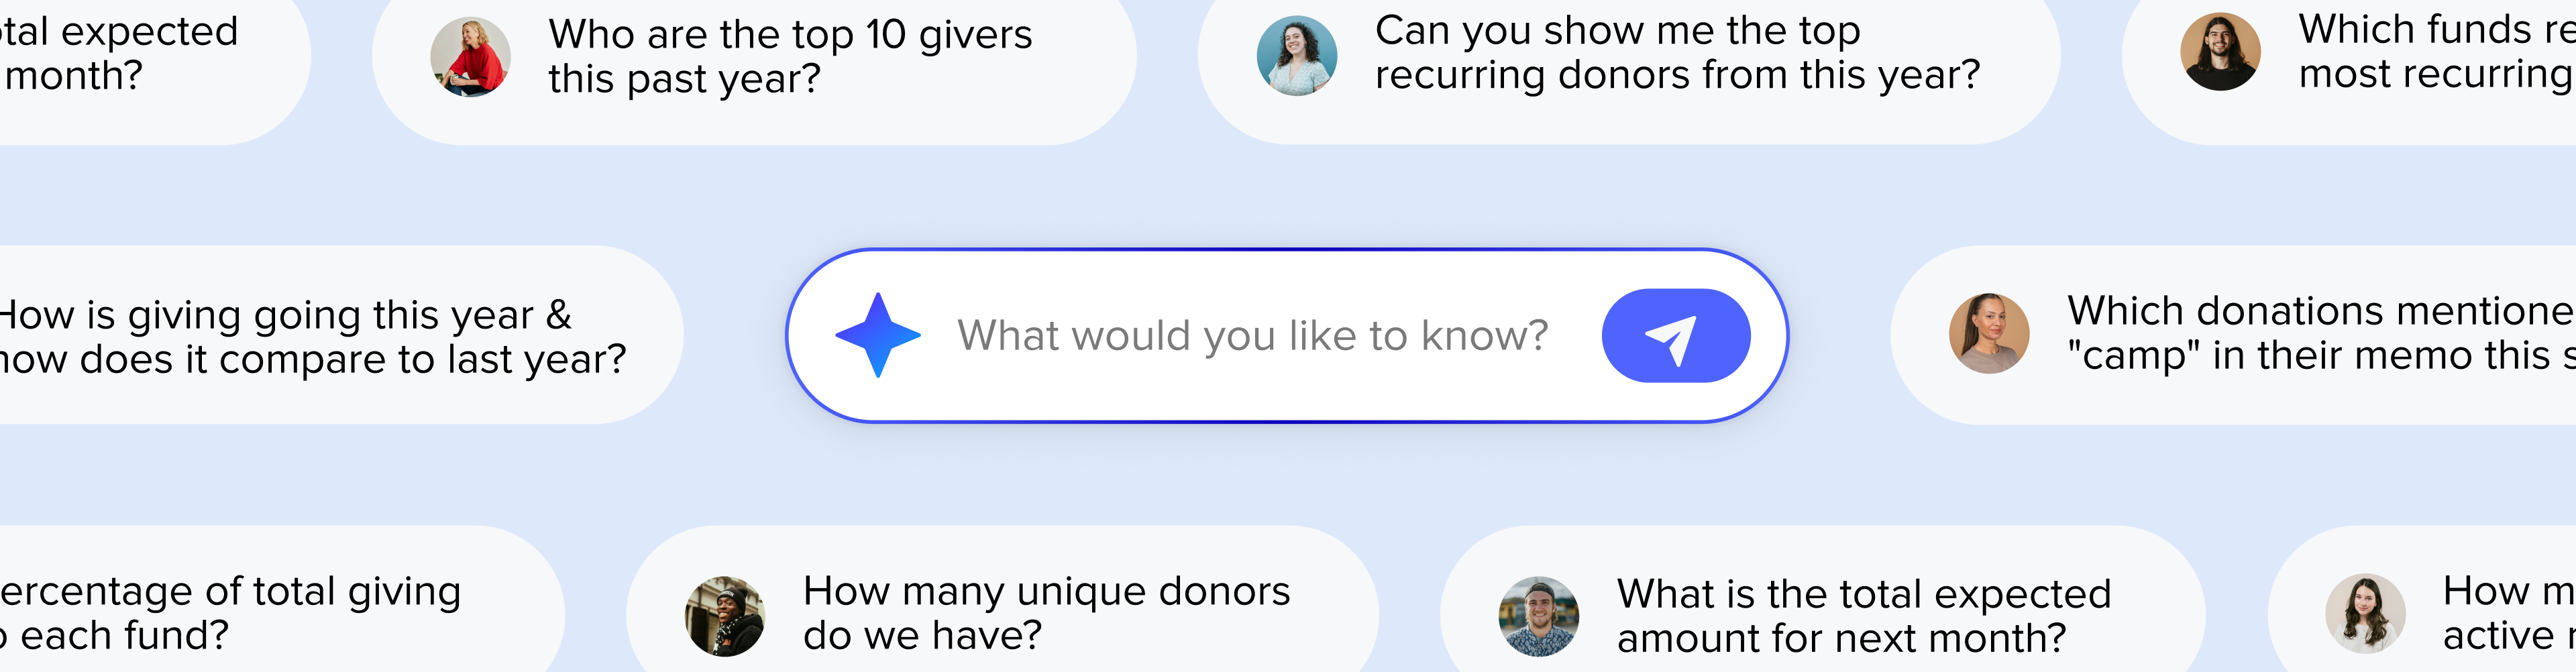
Additionally, with Trends AI you can type in a query and receive immediate answers. Imagine having the answers at your fingertips for questions like:
- “How many people were baptized this year?”
- “How much was pledged and raised for each of our fundraising campaigns?”
- “How many members do we have in small groups?”
- “What percentage of our members are recurring donors?”
- “What were our highest attended events this year?”
- “How many first time visitors did we have this year?”
Your report doesn't have to be a frantic December scramble. Trends AI has been quietly compiling the data itself for you. With instant answers at your fingertips, the data you need will not only be easily accessible, but your impact report will be detailed, accurate, relevant, and engaging.
What Trends AI brings to your impact report
A few features make Trends AI particularly well-suited for reporting:
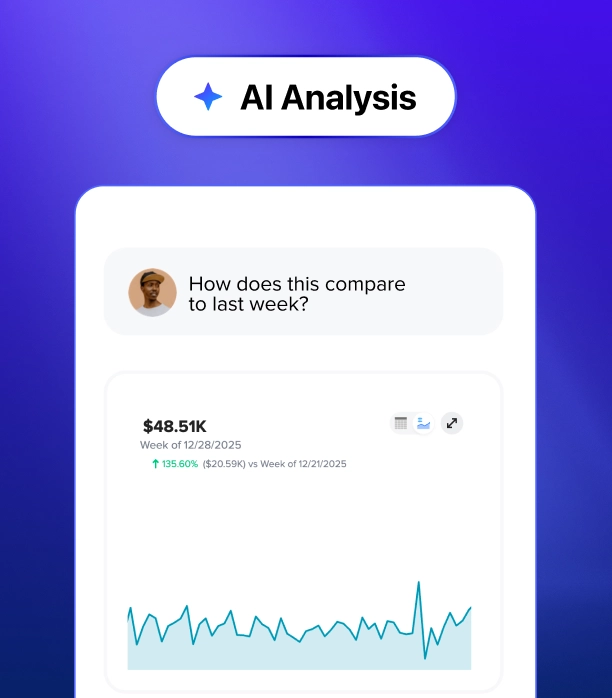
- Ask, and it builds. With AI Analysis, you can simply ask a question in plain language—something like "show me giving trends over the last twelve months" or "how many people were baptized this year"—and Trends AI generates the chart for you. No formulas, no exporting to a separate tool.
- 25+ chart types, ready to customize. Whether your report calls for a simple bar chart of giving by quarter or a heat map of small group engagement, the advanced chart builder gives you the visual that fits the story you're telling.
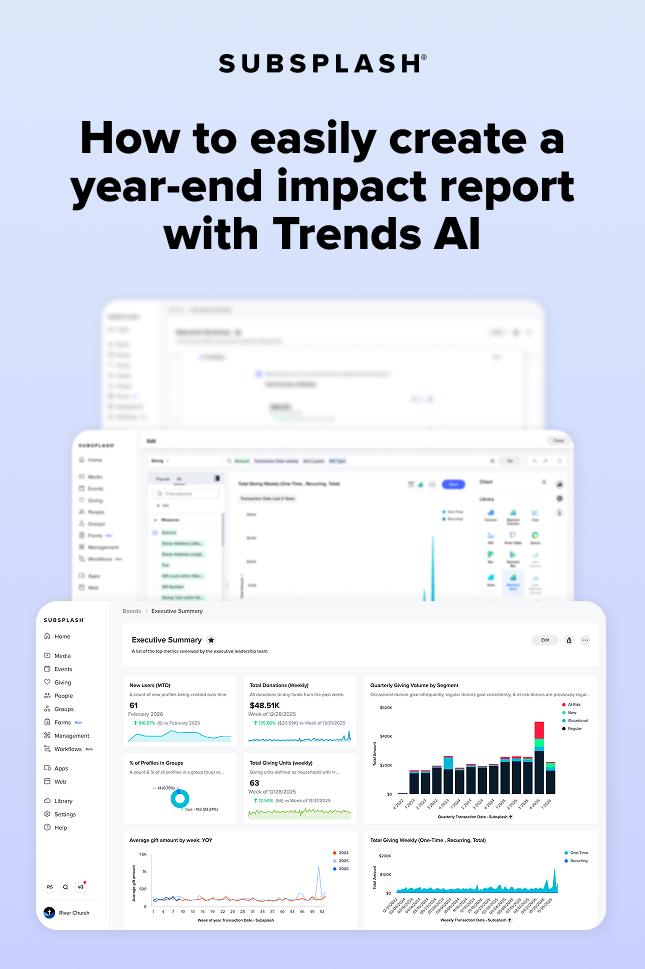
- Unlimited dashboards, built your way. Pin the charts that matter most into a dedicated year-end dashboard, complete with custom titles, subtitles, and annotations that add context for your board, staff, or congregation.
- One source of truth. Because Trends AI consolidates data across your entire Subsplash platform (and beyond), you're not stitching together five exports—you're pulling from one accurate, up-to-date picture.
- Export and present. Once your dashboard tells the story you want, you can export it for offline presentations, printed reports, or a digital version to share with your congregation.
Celebrate a trend of faithfulness
That stack of spreadsheets sitting in your church office? It's not just data. It's a year of faithfulness—every gift, every baptism, every meal served and life changed. Your congregation gave because they believe in what God is doing through your church, and they deserve to see that belief rewarded with real, tangible impact.
That's the heart behind a year-end giving report. And with Trends AI, you can see the fuller picture of what your tithers’ generosity is building. It empowers church leaders to hand your congregation something worth remembering instead of something rushed together in the final week of December.
As you step into planning for the upcoming year, give your congregation the report they deserve and let Trends AI do the heavy lifting so you can spend your time doing what matters most: ministering to more people during the holiday season.
Ready to turn a year of data into a report your congregation will actually remember? Explore Trends AI and see how easy your next impact report can be!
And if you’d like to learn more about how Subsplash’s AI tools can assist your ministry this year, [.blog-contact-cta]connect with our team today[.blog-contact-cta]!