Tools & resources to make disciples in a digital age, straight to your inbox.
Fill out the form below to schedule a demo or call our sales team at
469-564-3922
A better way to
gather
understand
present
interpret
visualize
act on
gather
How do you turn disparate data into impactful decisions?
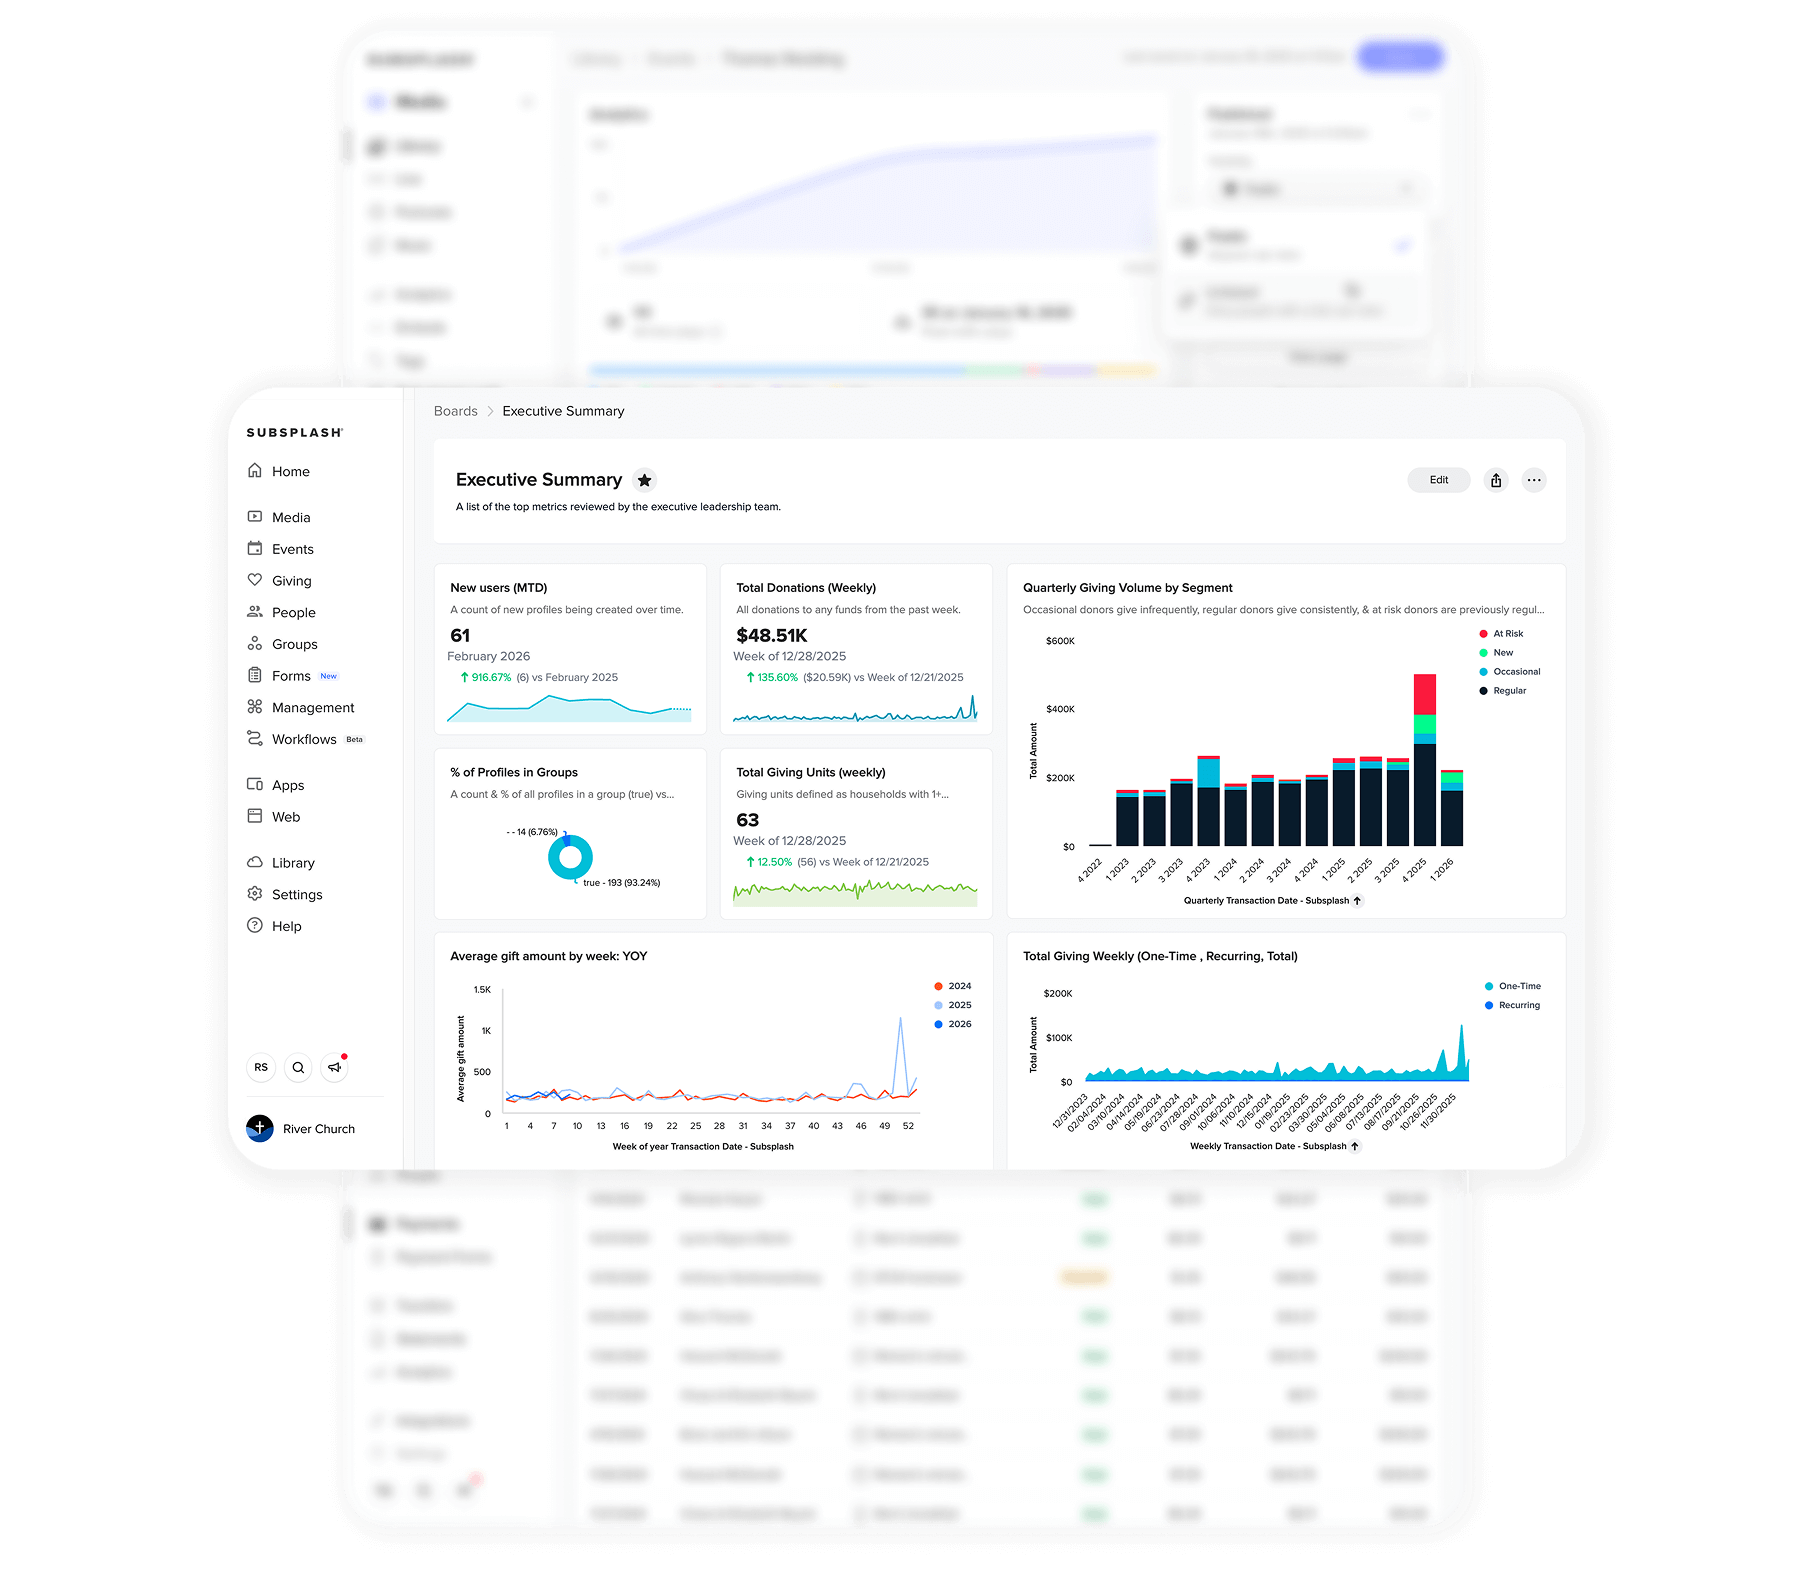
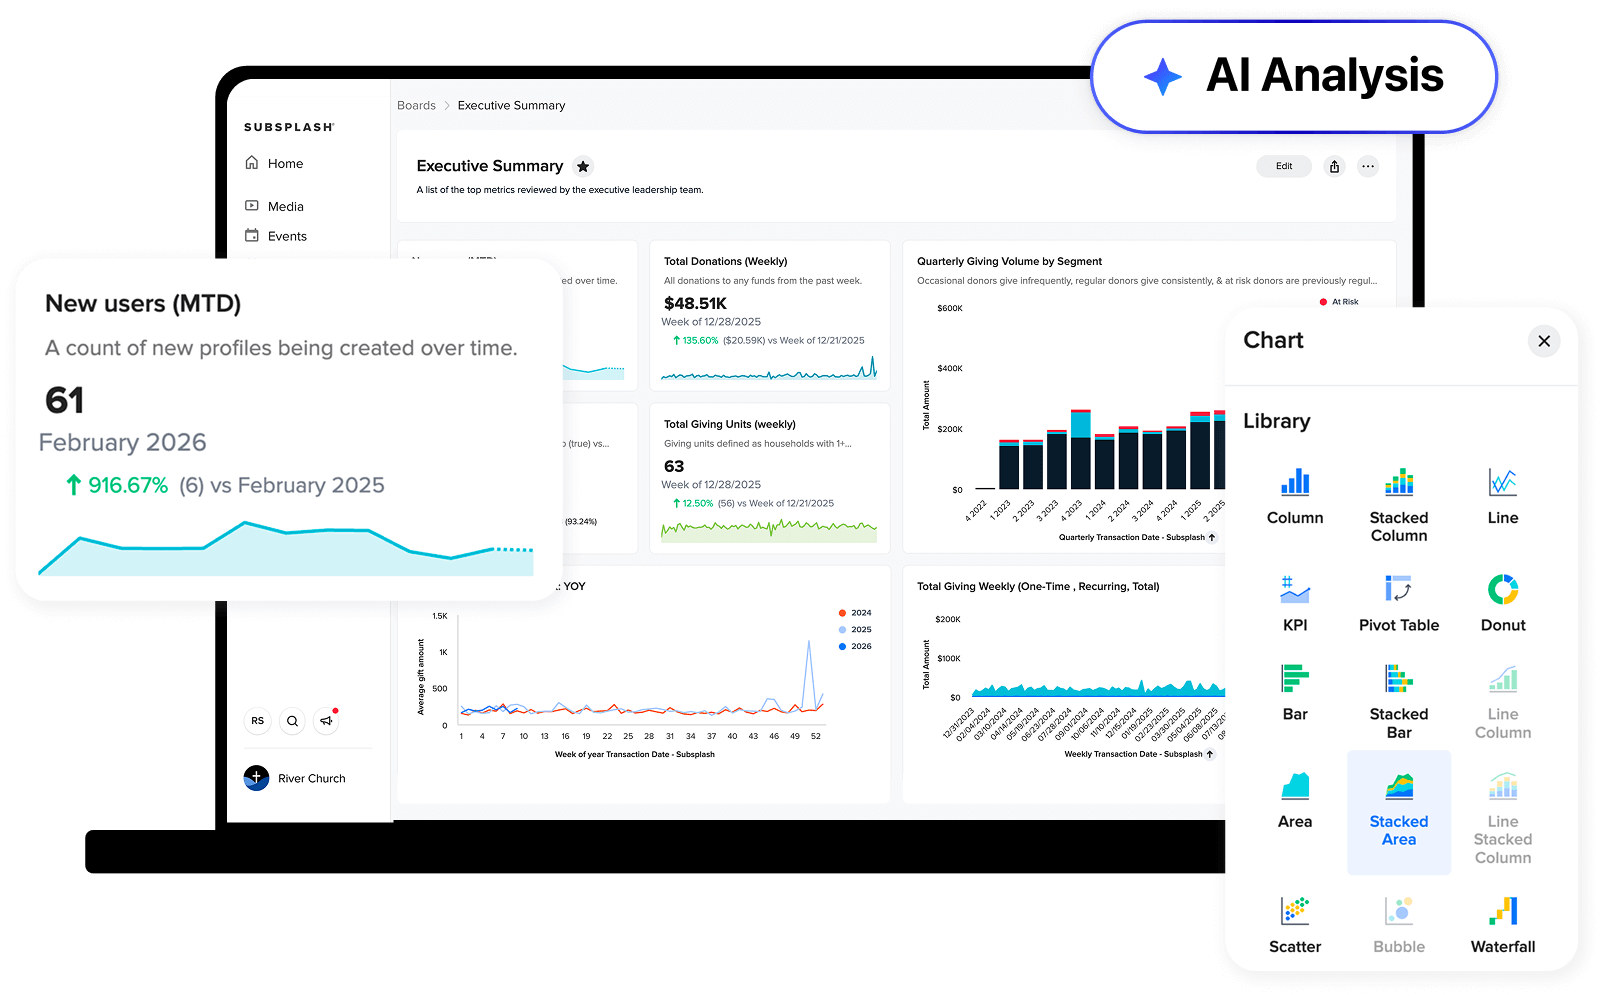
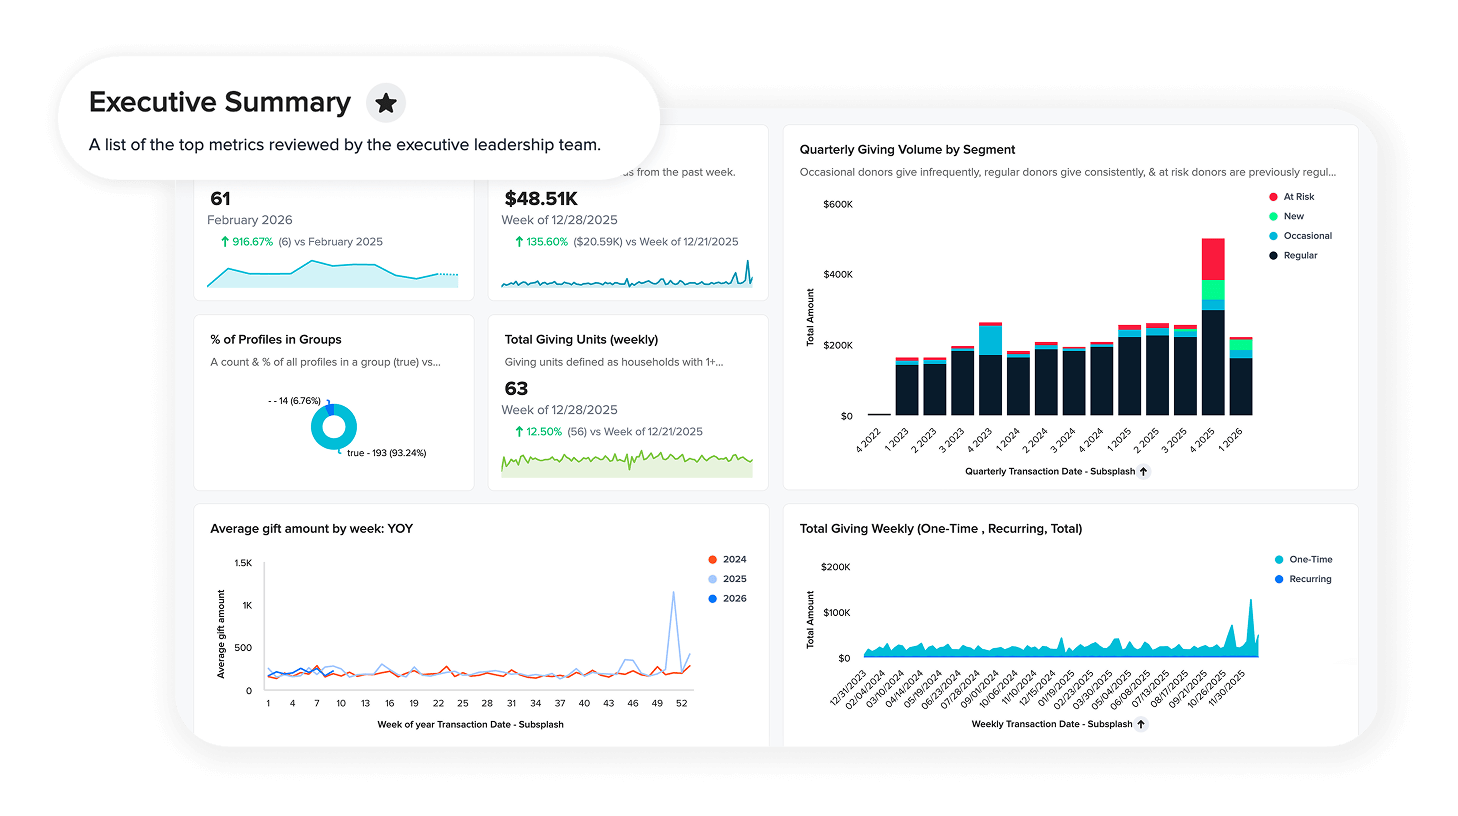
One place for your most important data sources
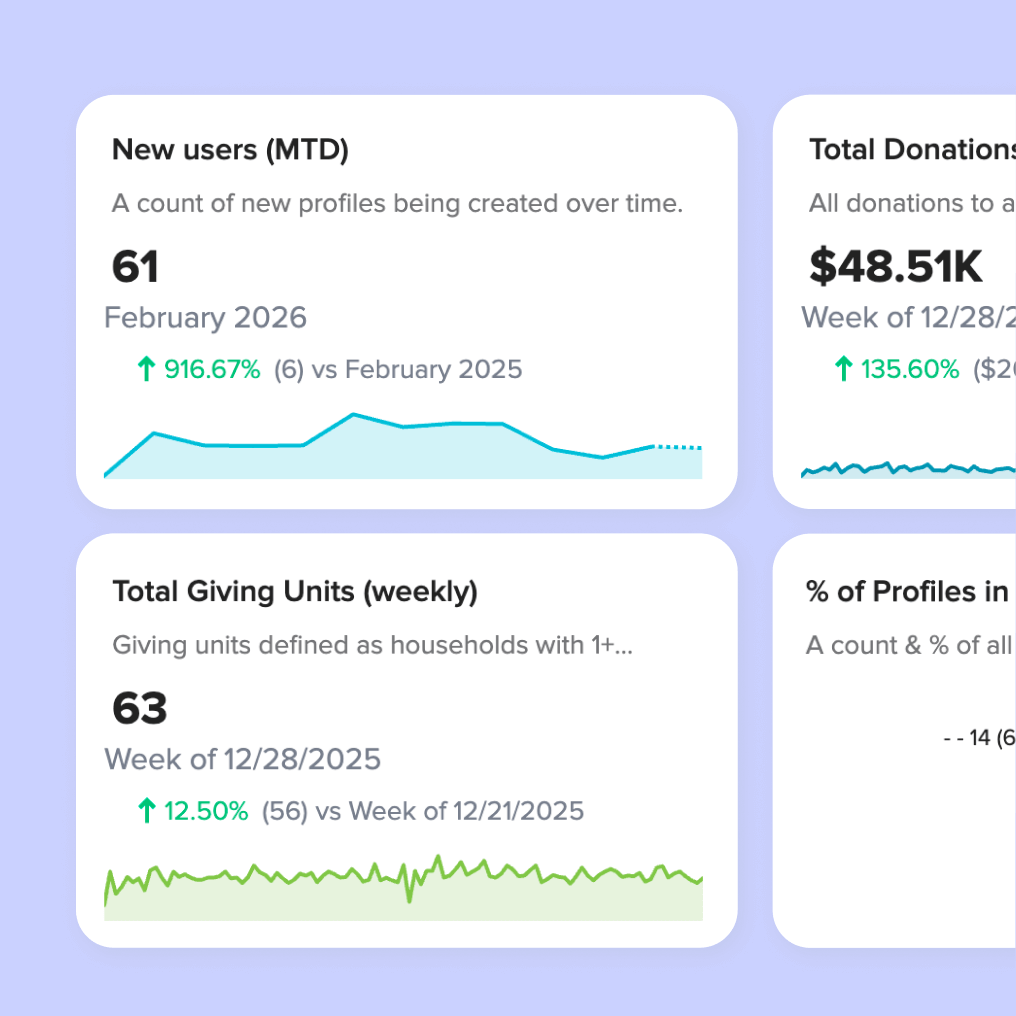
Easily create dashboards that combine data from key Subsplash sources—giving, campaigns, people, attendance, groups, and media—and external data.

Automatically refreshed every day
Dashboards update daily from all Subsplash sources, no need to re-calculate, re-prompt, or re-anything.
.png)
Turn silos of data into actionable intelligence
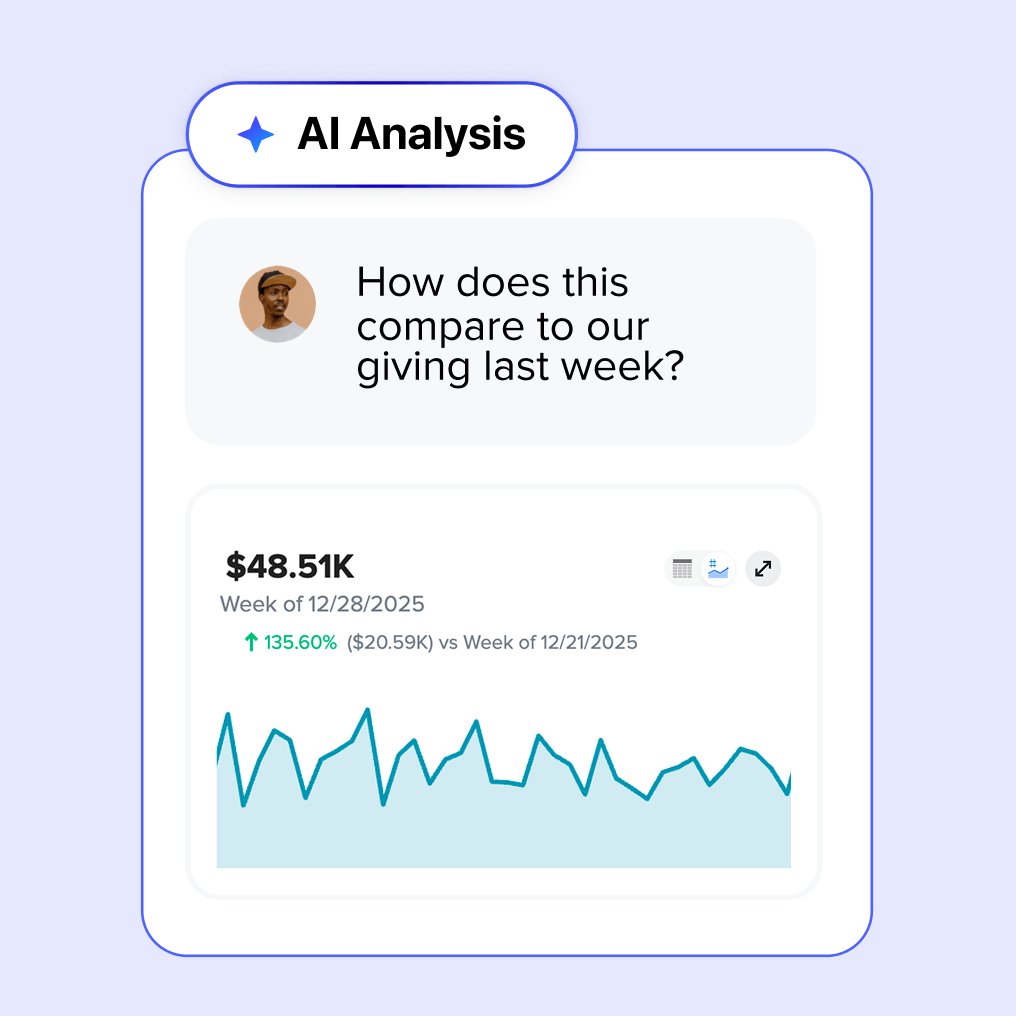
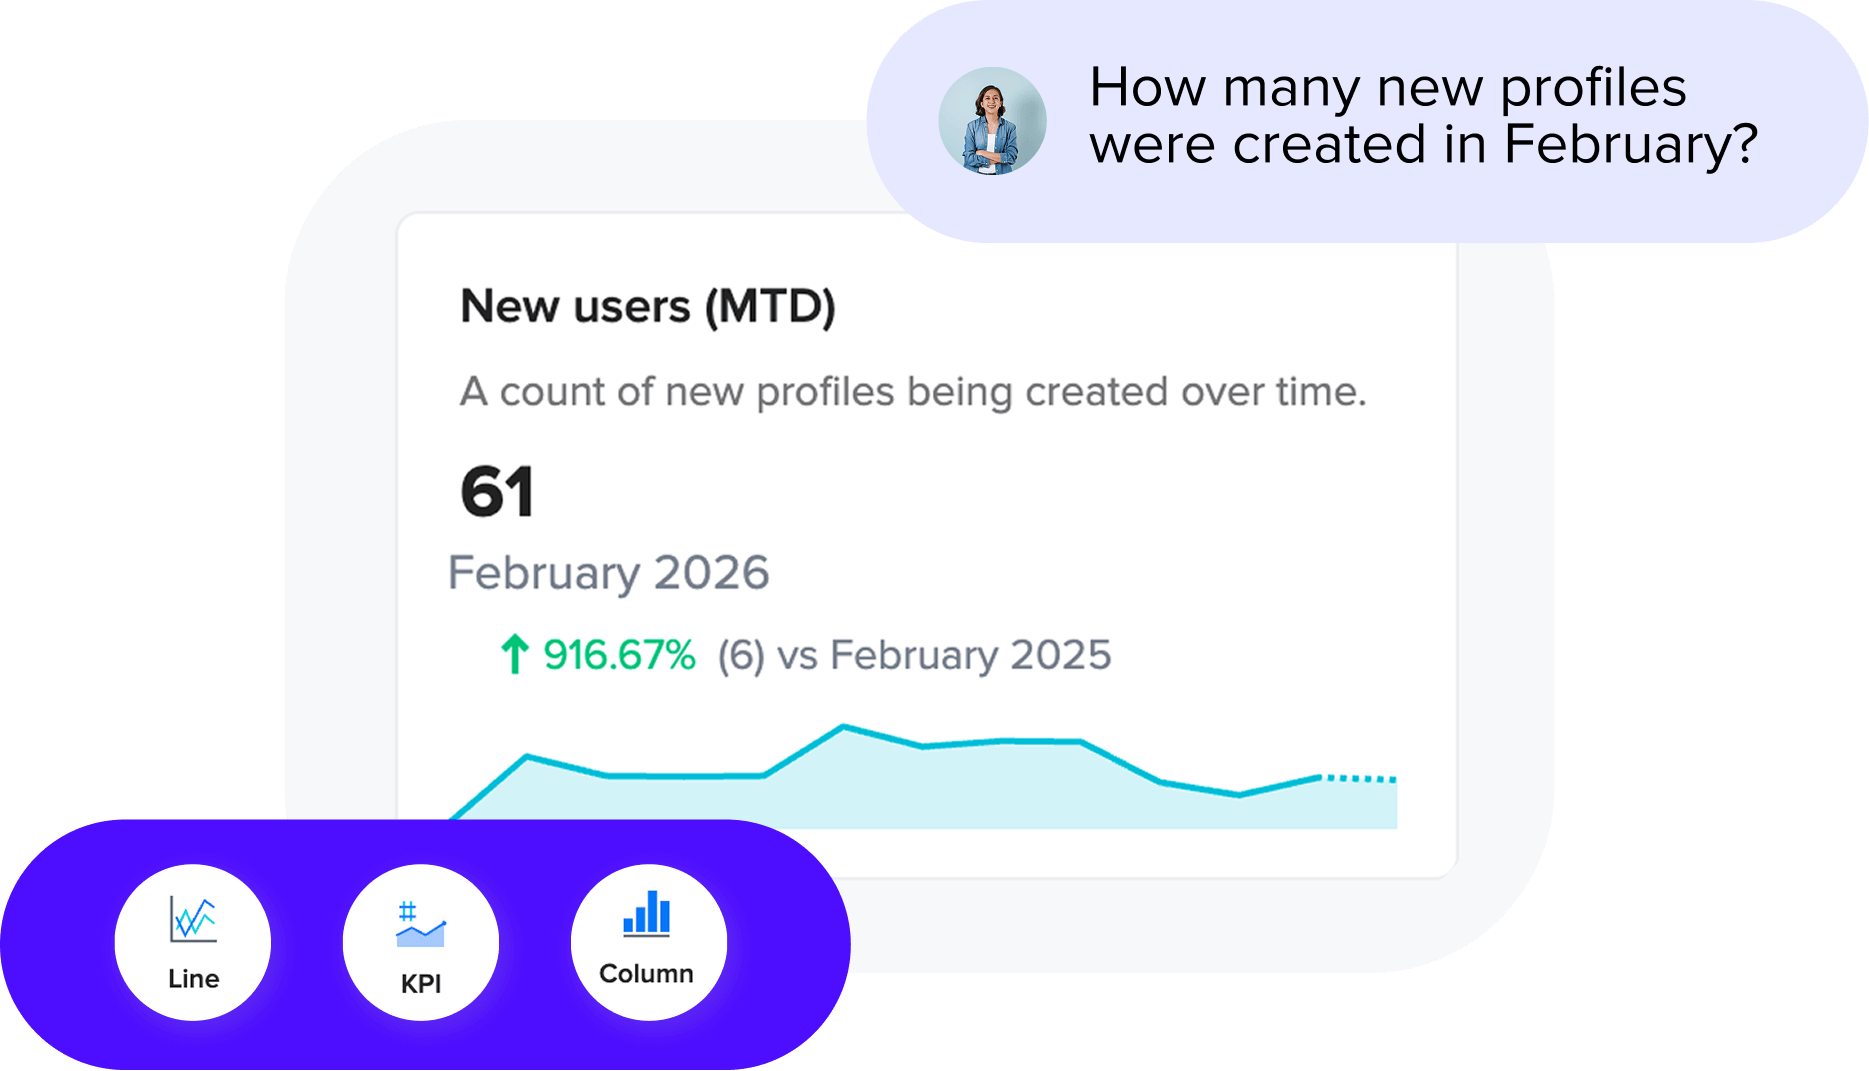
Share dashboards across your team to ensure every big decision is data-informed. If you need extra insights, just ask for more detail with AI Analysis.
AI that understands your church.
Everything you need for data-informed decisions
Subsplash Trends AI is more than just a sum of its parts. Drill down deeper than you can with just a dashboard. Visualize more efficiently than just a chart builder. And stop asking your chatbot the same questions every day.
Pick the plan that meets your needs
Premium Consulting
Standard Consulting
Get your head out of your spreadsheets
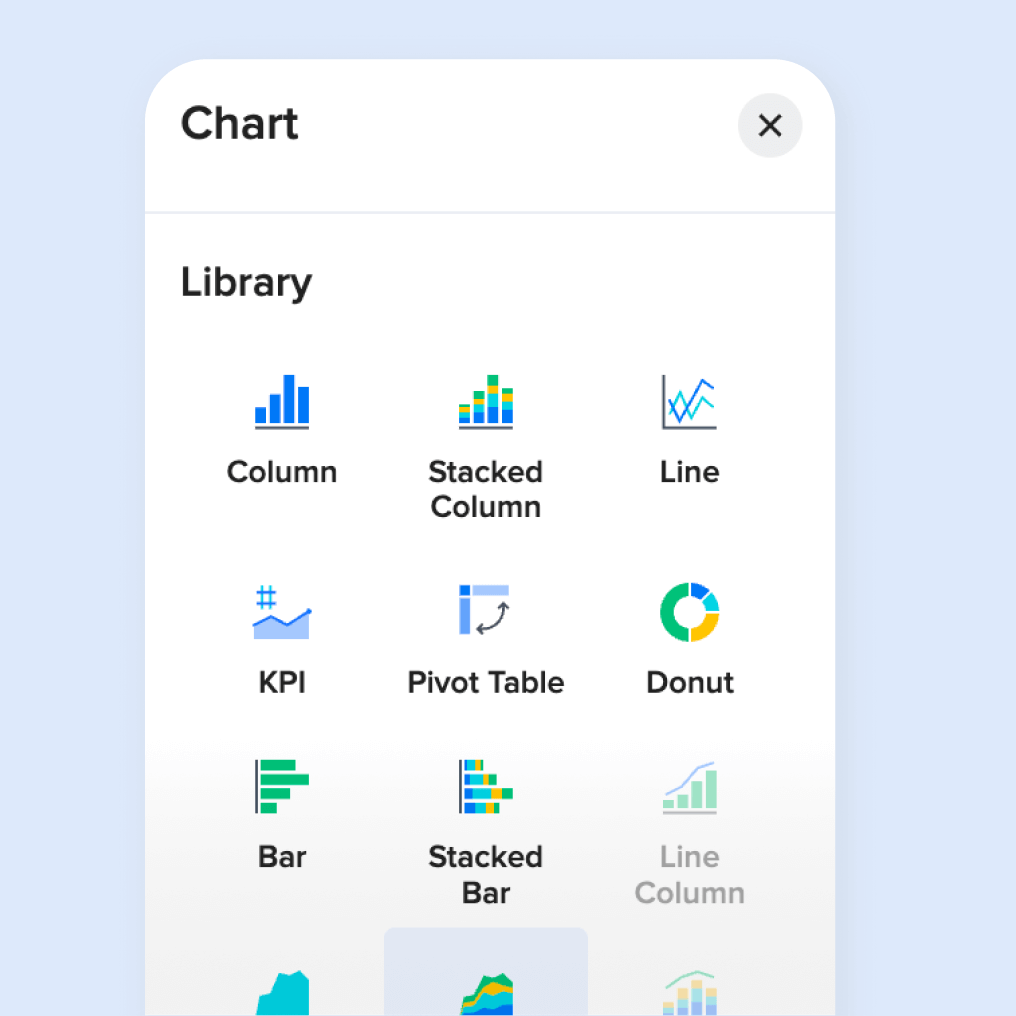
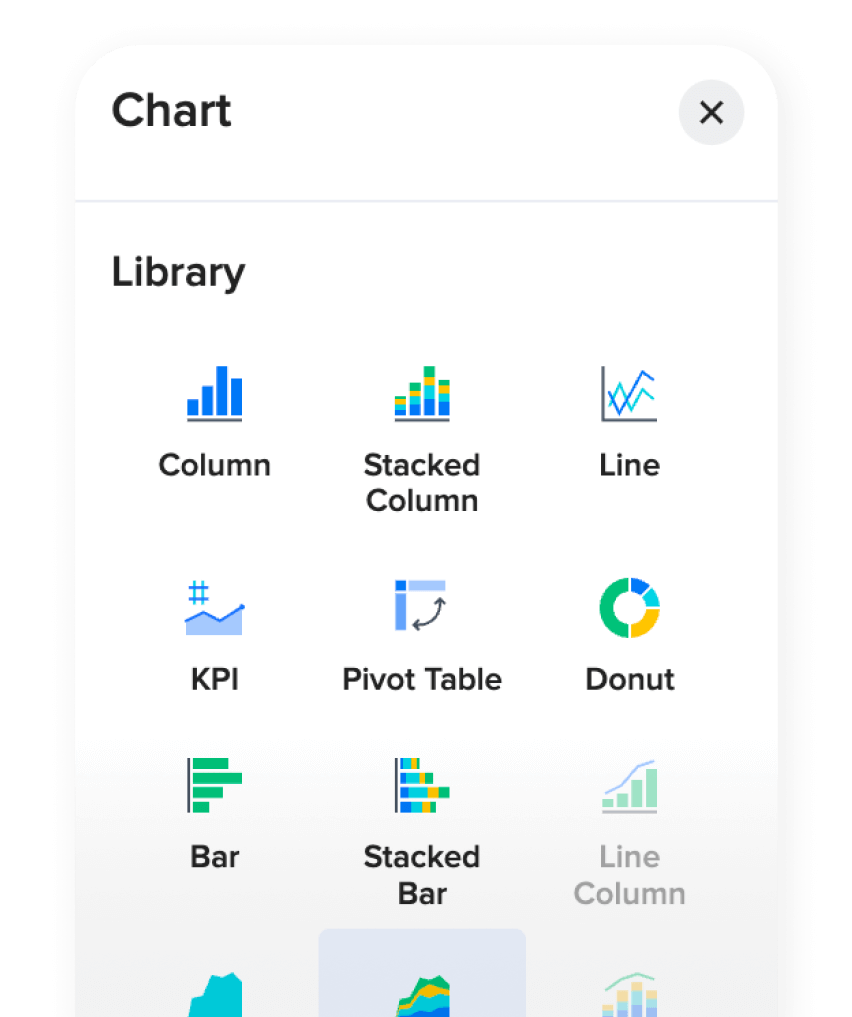
Build and customize 25+ chart types in real time using variables, filters, and formulas, or simply by asking.
Pin charts to unlimited dashboards with custom layouts and multiple tabs.
Start with pre-built dashboards to meet the most common needs for churches like yours.
Ask AI to create or refine a chart, drill down deeper, or even suggest questions to ask.
Active AI training and monitoring by Subsplash experts specifically to meet the needs of churches.
Add context to dashboards with custom titles, subtitles, and annotations.

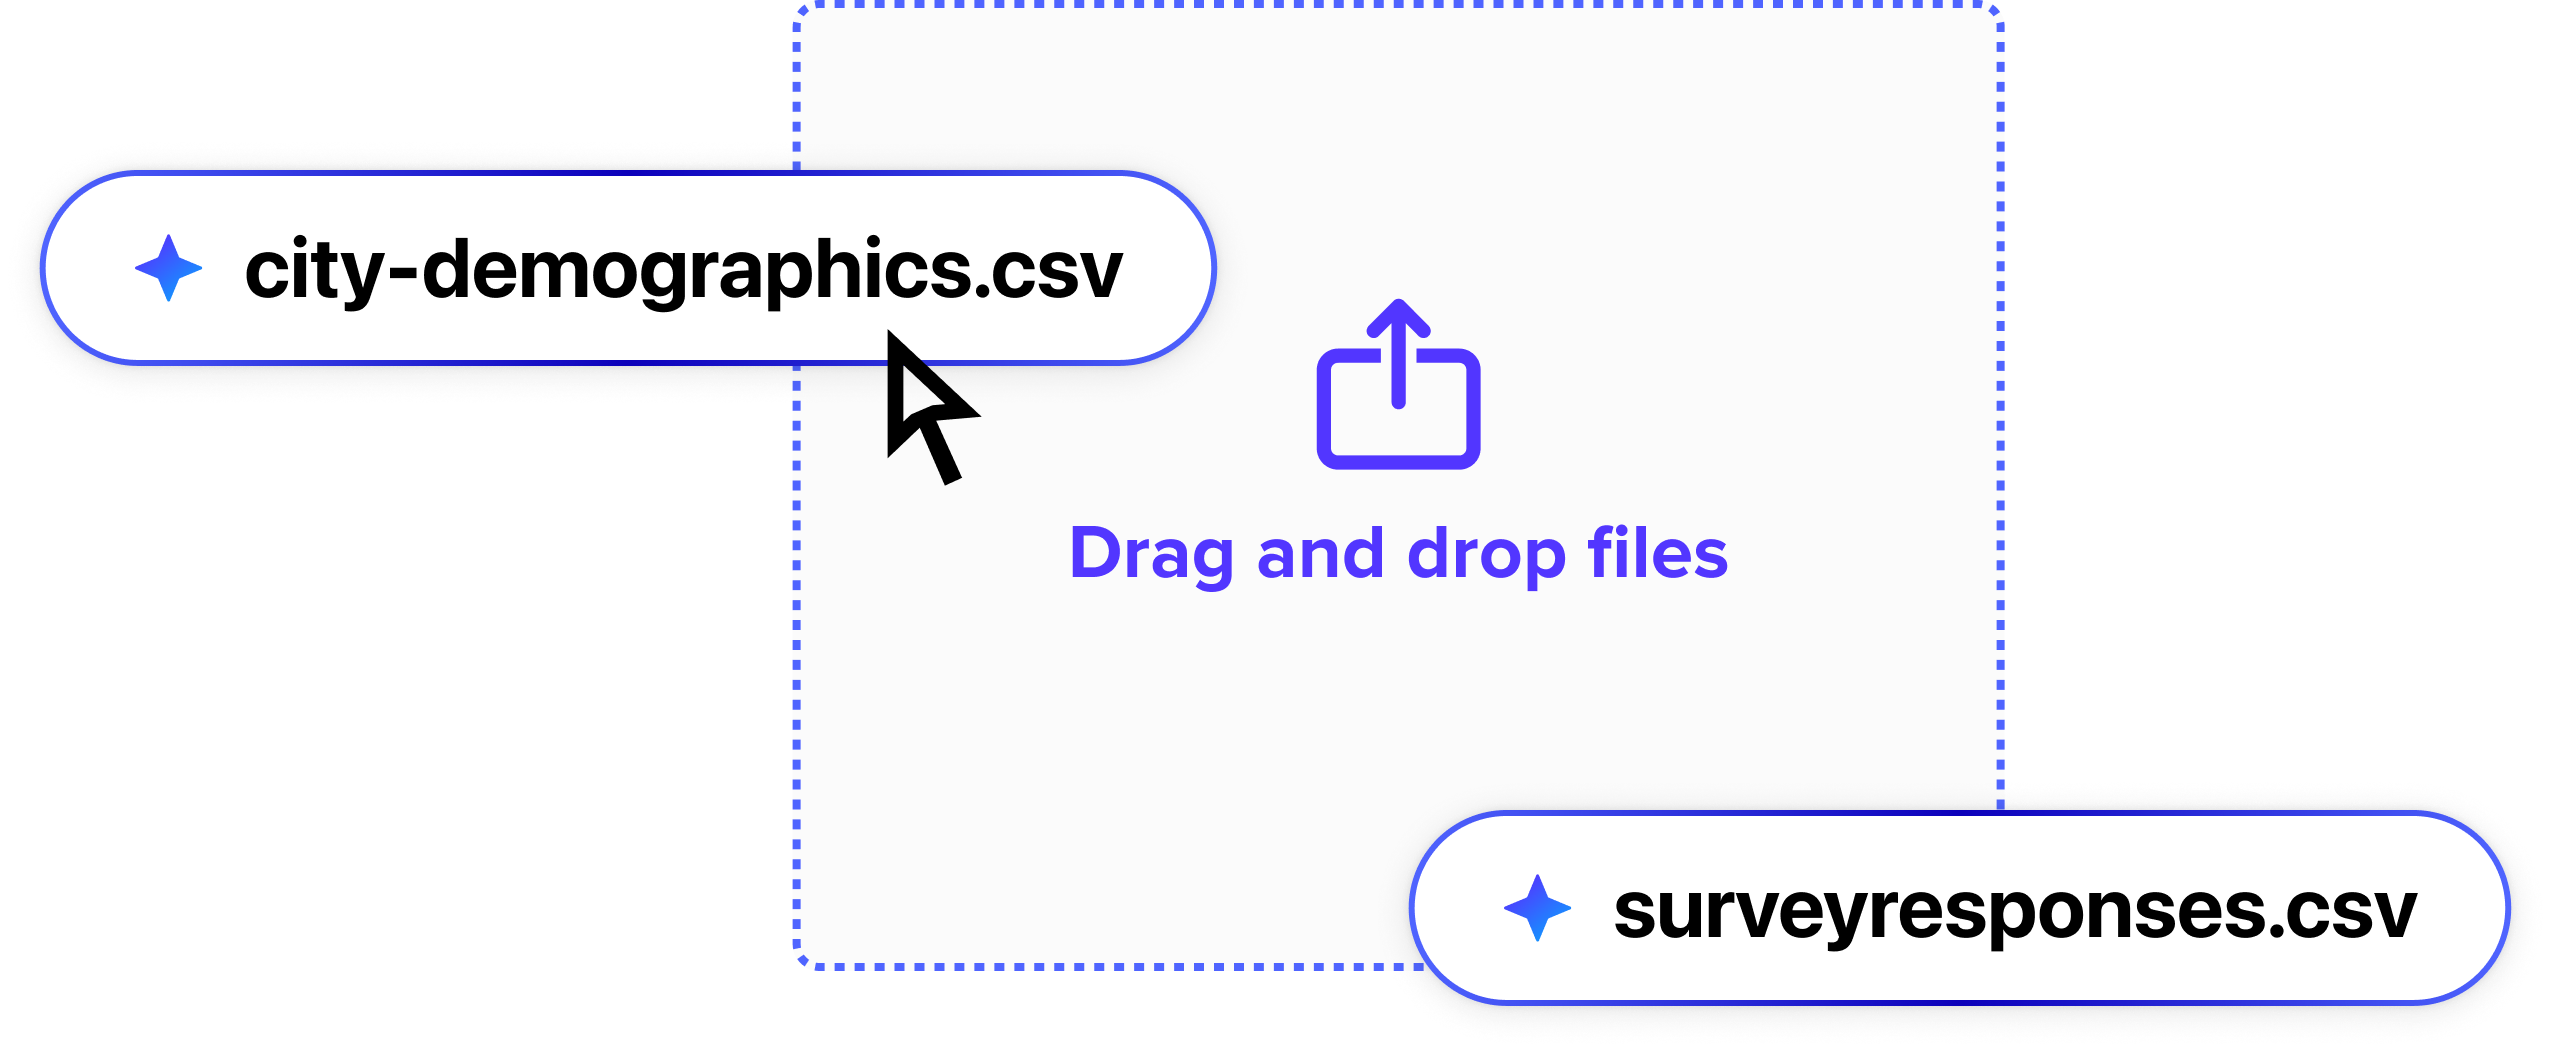
Import outside data into Trends AI to analyze, visualize, and present alongside your Subsplash data.
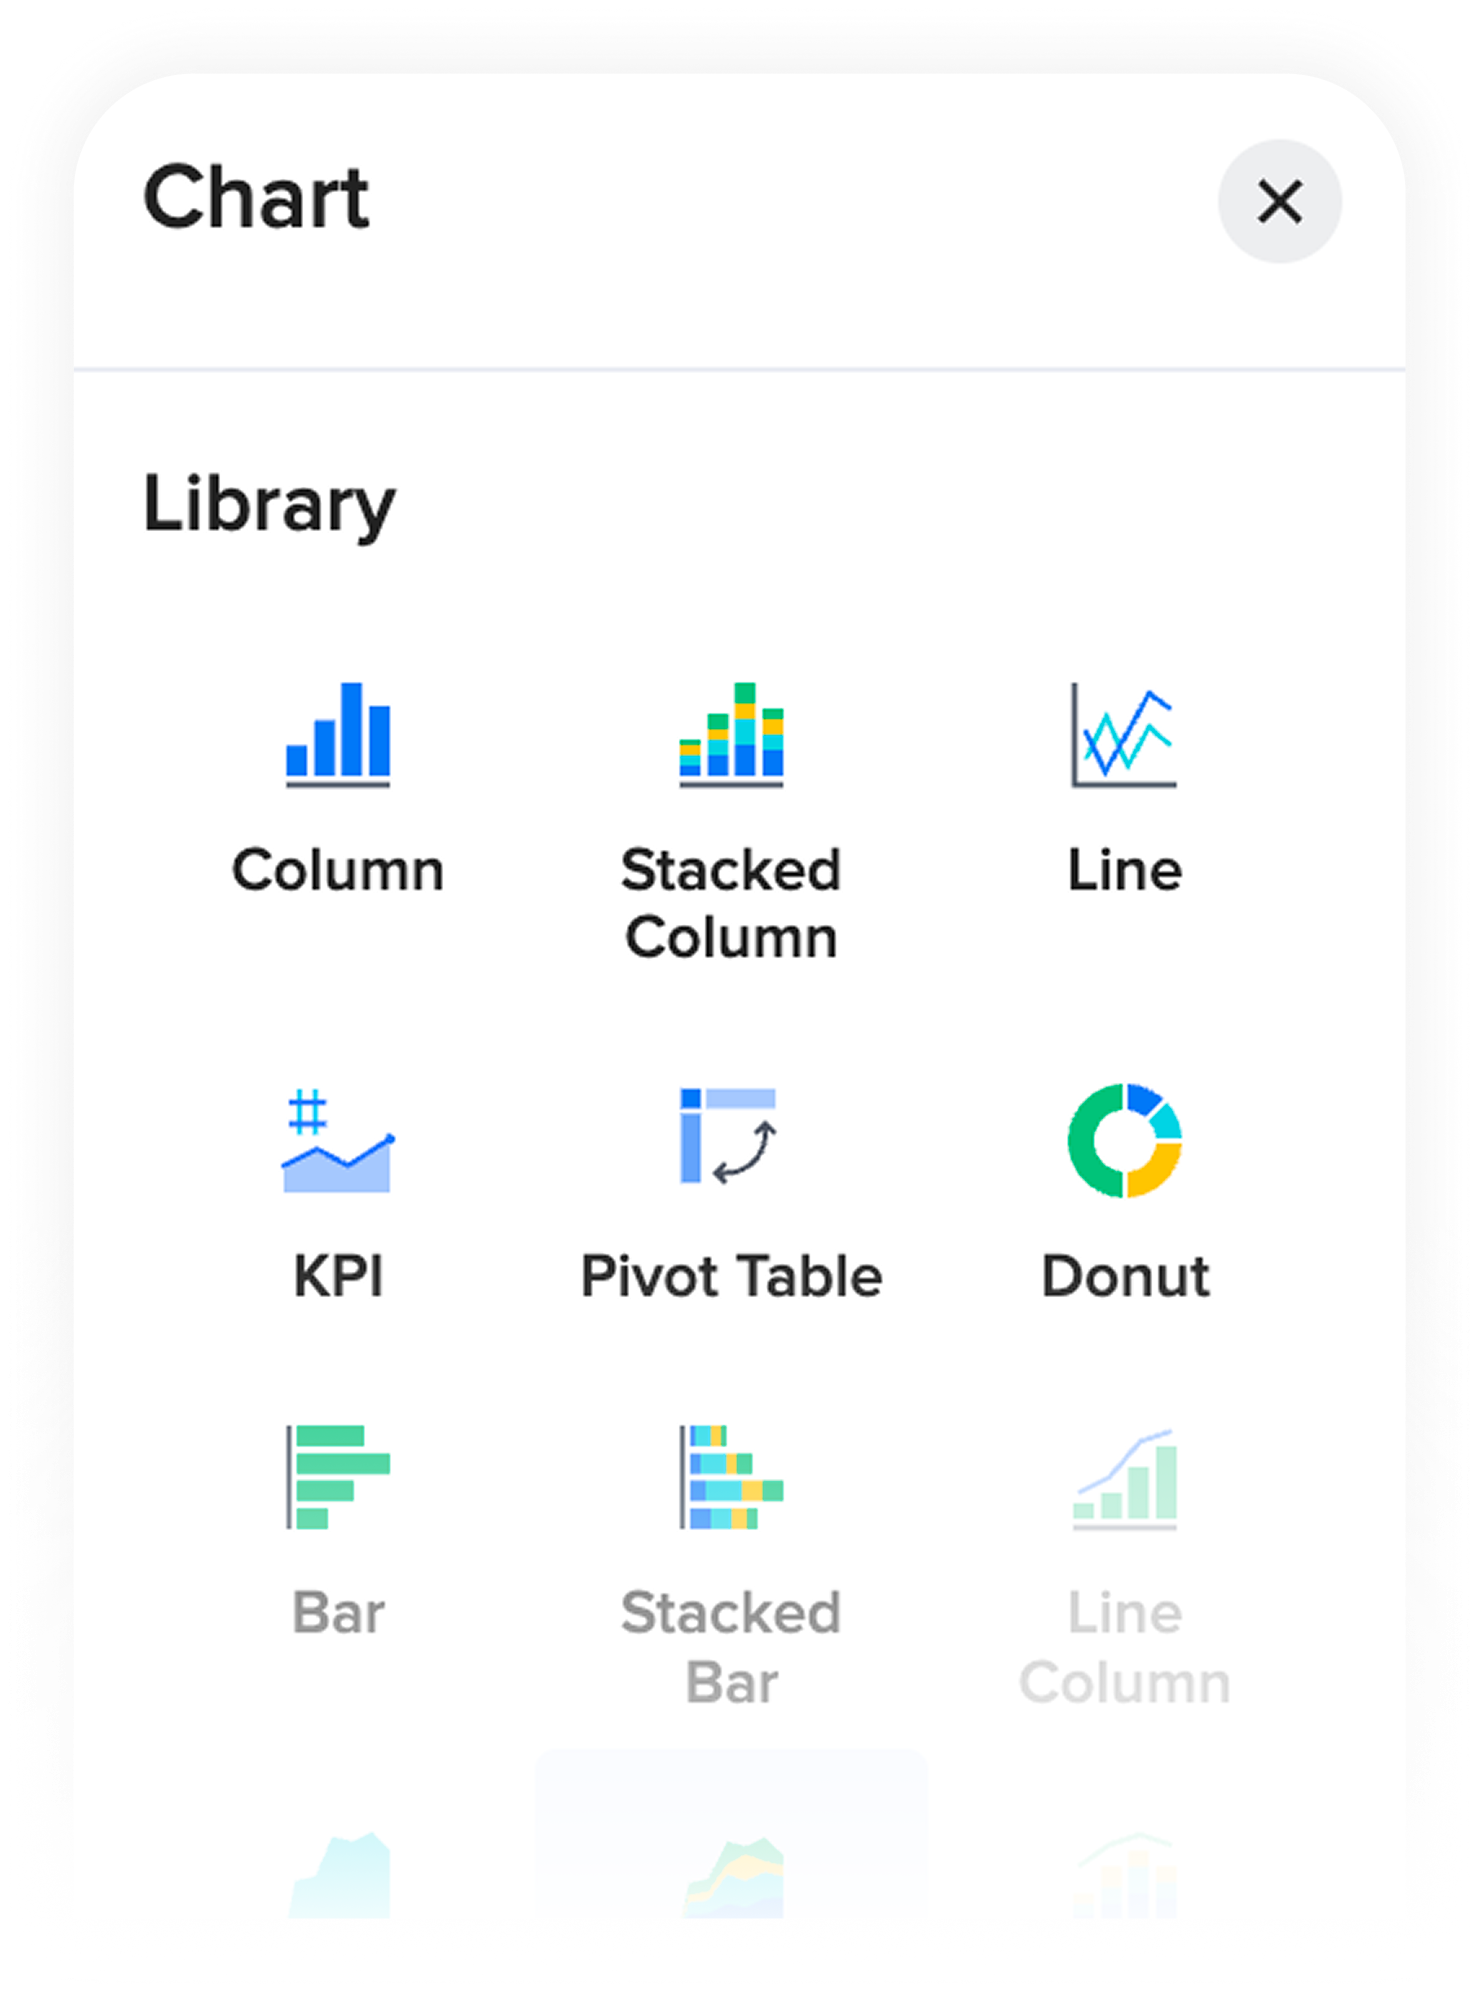
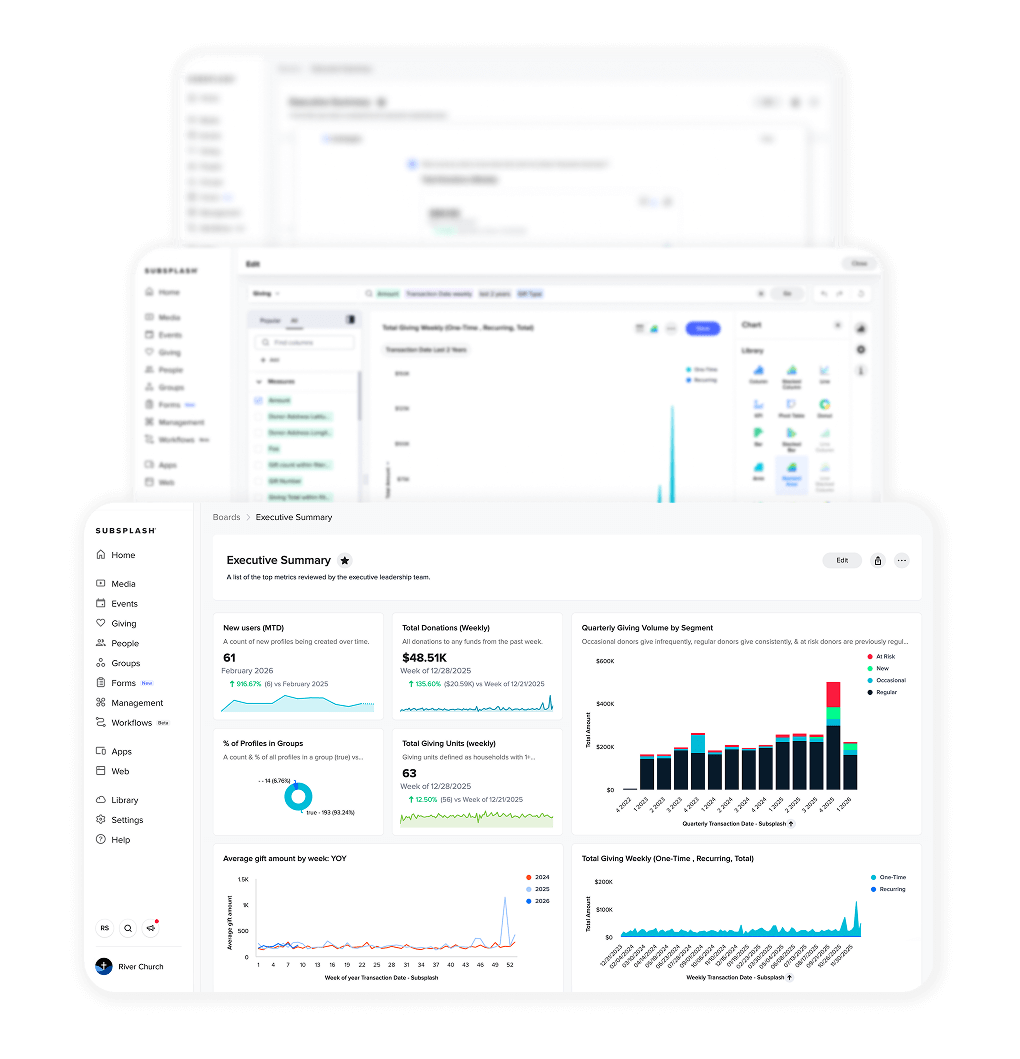


Build & customize 25+ chart types in real time using variables, filters, and formulas, or simply by asking.
Pin charts to unlimited dashboards with custom layouts and multiple tabs.
Add context to dashboards with custom titles, subtitles, and annotations.
Start with pre-built dashboards to meet the most common needs from churches like yours.
Ask AI to create or refine a chart, drill down deeper, or even to suggest questions to ask.
Active AI training and monitoring by Subsplash experts specifically to meet the needs of churches.
Import data from non-Subsplash data into Trends AI to analyze, visualize, and present alongside your Subsplash data.
Even more features
View only permissions
Share live access to dashboards with ministry leaders, without access to the sensitive underlying data. (Coming soon!)
Daily data refresh
All Subsplash data updates over night for fresh insights in the morning.
Export capability
Export dashboards, charts, tables, and reports for offline presentations.
Trends AI FAQs
What is Trends AI?
Trends AI is your ministry’s new “intelligence hub.” It’s a powerful tool that gathers your fragmented church data into beautiful, easy-to-read dashboards. By combining your Subsplash data with conversational AI, it helps you stop guessing and start seeing exactly how your ministry is flourishing.
Why should my church use Trends AI?
Trends AI helps get your focus off spreadsheets and back onto ministry. It turns tons of data into a clear roadmap, allowing your team to make confident, data-based decisions that align with your mission.
How easy is it to use?
We built Trends AI for instant expertise. You don’t need to be a data scientist—simply ask it to build a chart for you, or jumpstart your progress using pre-built templates designed specifically for common church needs.
Can I combine data from different sources?
Absolutely! Trends AI acts as a single source of truth for your church. You can consolidate your core Subsplash data with external sources into one unified dashboard, giving you a 360-degree view of your community.
How many dashboards can I create with Trends AI?
There are no limits! You can create unlimited dashboards with custom layouts and multiple tabs to track everything from Sunday attendance and giving trends to small group engagement.
How often is the data updated?
Say goodbye to manual exports! Your dashboards refresh every single morning with the latest Subsplash data. You’ll wake up to fresh insights without having to calculate a formula or prompt the system.
What kind of charts can I build?
If you can dream it, you can visualize it. You have access to over 25 different chart types. Whether you use our advanced builder or just ask the AI to “show me giving trends over the last six months,” you’ll get professional-grade visuals in seconds.
How does the AI Analysis feature work?
Think of it as a conversation with a data expert. You can ask the AI to “drill down deeper” into a specific trend, refine a chart, or even ask it to suggest questions you should be asking about your data.
What data sources are available in Trends AI?
Trends AI includes data for giving, recurring giving, people, group membership, group event attendance, event attendance, media content performance, and campaign tracking. You can also import external data via CSV to analyze alongside your Subsplash data.


© 2026 Subsplash