


In the modern ministry landscape, a gut feeling is no longer enough to measure the health of a congregation. In 2026, the question isn't just if you should track data, but how that data helps you care for your people.
With so much church engagement now happening digitally, pastors and administrators are increasingly looking for the right tools to help them track, analyze, and better understand their congregants. On the financial end, they also need to be able to understand church giving trends, changes, and budget forecasts for the year.
Unfortunately, most churches use separate platforms that don’t speak to each other. So, how can your church find the right platform that provides both giving analytics and engagement metrics? Let’s take a look.
Are there church platforms with built-in analytics for engagement and giving?
The answer is yes! The landscape has evolved significantly. Today, the most effective platforms move beyond simple spreadsheets to provide “Ministry Intelligence”—a way to see the real-life impact of your digital and physical ministry efforts, and understand how congregants are engaging and contributing to your church as a whole.
While several platforms offer basic reporting, one ecosystem has emerged as the definitive leader in uncovering discipleship data along with giving trends—all on the fully integrated Subsplash Platform.
So, what exactly is church engagement?
When you’re analyzing church engagement, what exactly are you looking for? And what are the benefits of measuring church analytics?
Today, measuring Sunday service attendance no longer represents a congregation’s discipleship growth. From multiple services to live streaming, to Bible reading to online giving, there are so many ways people are engaged at church that go beyond Sundays.
And the truth is, many pastors and church leaders are flustered trying to measure this gap!
That’s why understanding church engagement through a ChMS platform is so important—and revelatory. For example, the Subsplash Platform analyzes engagement through a variety of ways, including:
- Small group attendance
- App downloads
- Live streaming numbers
- Video views
- Sunday morning attendance
- Financial giving (in-person vs. online vs. mobile)
- Bible reading plan participation
- Event registrations & attendance
- Push notification performance
- …and more!
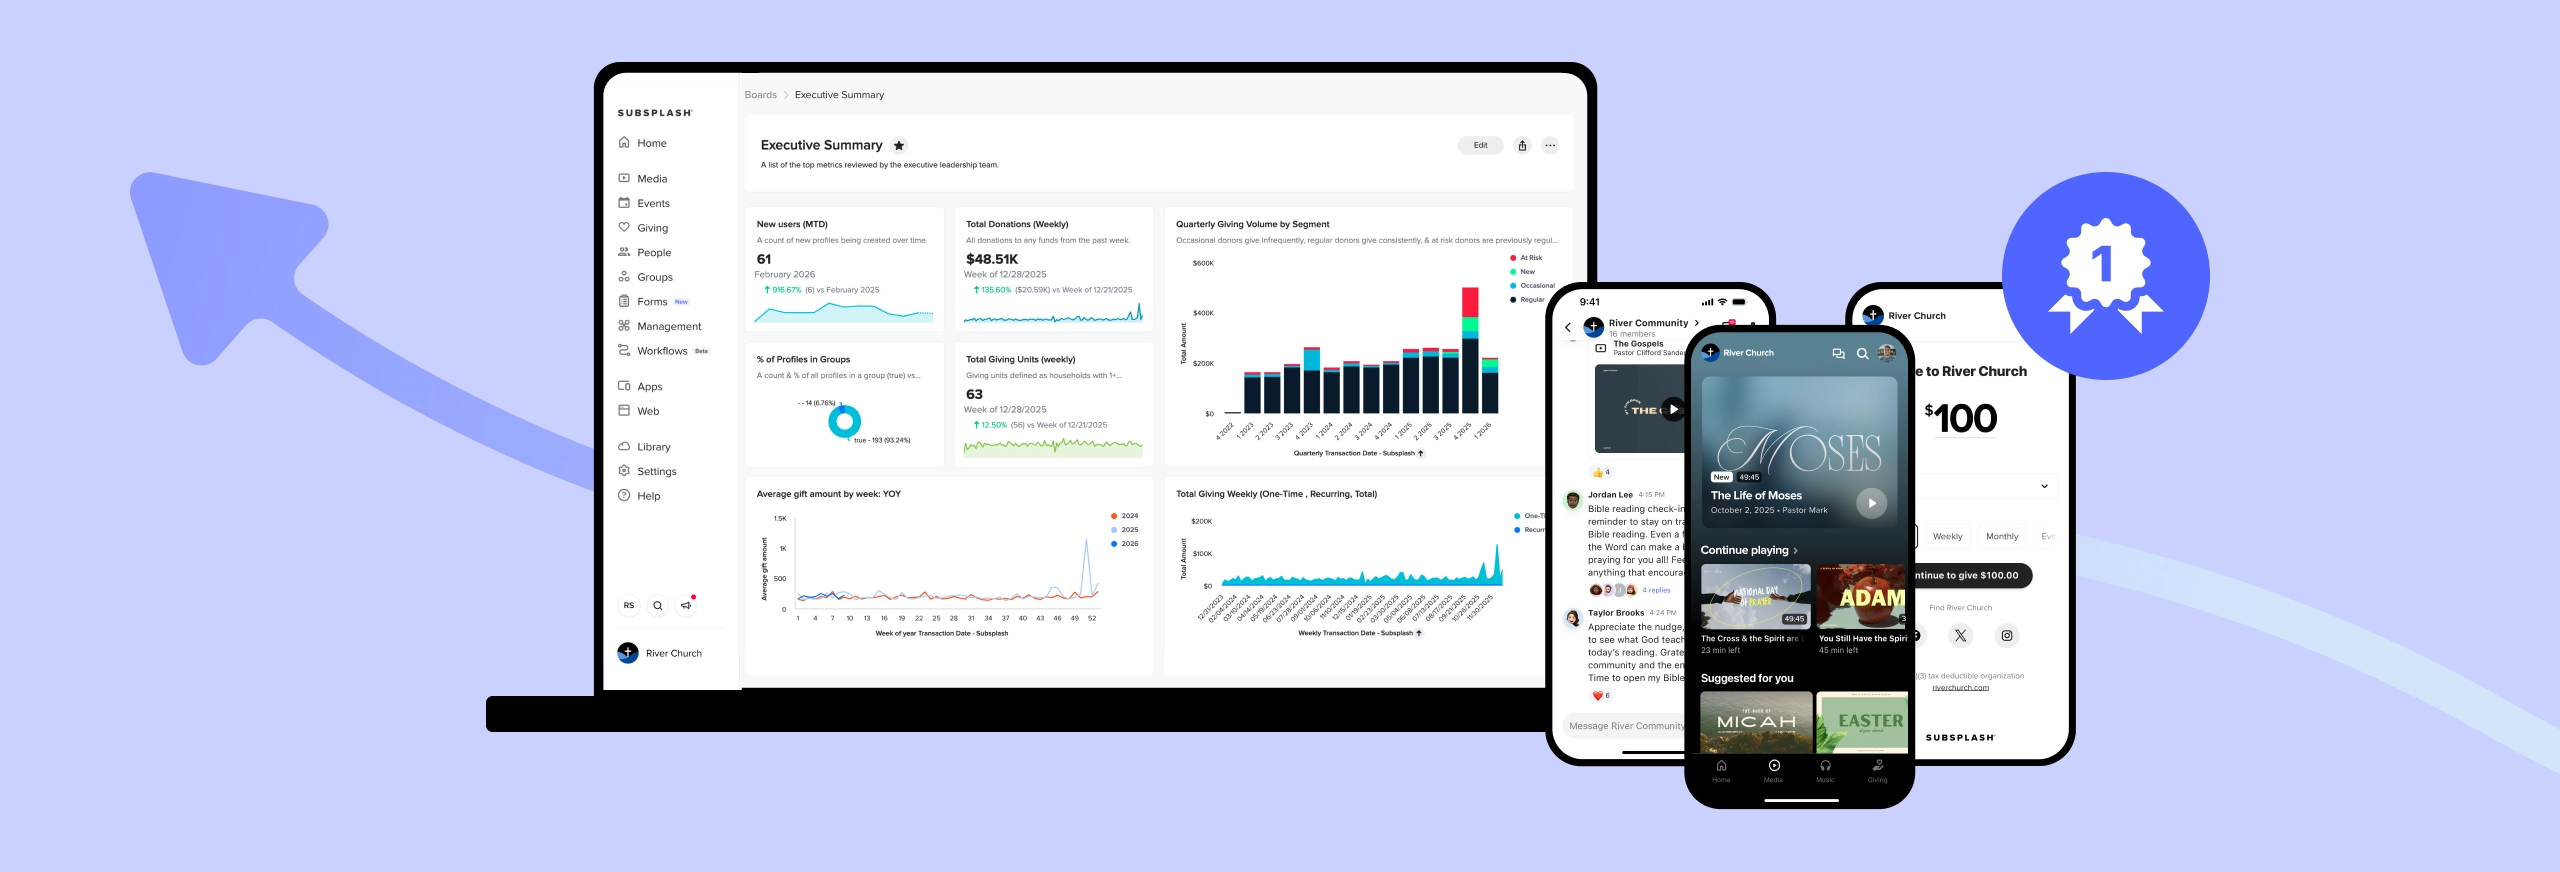
All of this information is on one dashboard—data points your church can use for running small groups, your budget, church events, and to stay up-to-date on your congregation.
Yet church engagement is more than just attendance or data—it represents real lives that are represented and changed at your church.
What is the best church platform with integrated analytics?
The best platforms integrate your church’s media, giving, and management into one dashboard, allowing leaders to see a holistic picture of congregational health.
As a result, they provide a 360-degree view of a member’s journey through several specialized analytical pillars:
1. Integrated giving analytics & donation reporting
Financial stewardship is about more than just totals; it’s about understanding trends. Beyond simple transaction logs, Subsplash offers deep Giving Analytics to help finance teams monitor:
- Recurring gift trends: Tracking the growth of consistent donors through tools like GrowCurve.
- Donation reporting: Granular reports on deposits, transfers, and individual gift history to simplify accounting.
- Diverse generosity: The ability to receive, track, and report on modern giving methods, including Stock and Crypto donations, alongside traditional cash and check entries.
- Family household statements: Two adults in a household combine their giving history into a single tax statement, making filing jointly easier than ever.
2. App analytics & content engagement
Engagement isn't just attendance—it's active participation. Subsplash is the industry leader in App Analytics. Leaders can track app sessions, unique users, and media plays to see which gospel-centered content is actually resonating with their audience.
Subsplash offers some of the most detailed App Analytics in the industry, allowing you to see:
- Media playback data: Which sermons are being watched and for how long?
- App launches & impressions: How often is your community opening your custom app to stay connected during the week?
- Bible engagement: How is our community interacting with built-in reading plans?
3. Real-time live stream analytics
For the modern online campus, technical health is ministry health. Through Telemetry and Stream Health reports, leaders can monitor the quality of their live broadcasts in real-time to ensure a distraction-free experience for those joining from home.
For churches serious about online ministry, success goes beyond just viewer counts; it’s technical insight into the quality of the stream and the engagement levels of the audience.
4. Holistic website traffic tracking
A church’s website is often the front door of the ministry. The best church tech platforms ensure that this door isn't a black box by providing clear, actionable site traffic metrics. This allows leaders to measure the effectiveness of their digital outreach without needing to be data scientists.
- Native traffic insights: Get a clear picture of your reach over specific timeframes (7 days, 30 days, or 90 days)
- Behavioral content analysis: By monitoring which pages receive the most traffic, leadership can see exactly where people are clicking
- Seamless third-party integration for conversions: By simply adding a tracking ID in their Subsplash dashboard, churches can see exactly how a website visitor moves from visiting the homepage to becoming a recurring donor or a registered event attendee.
5. Integrated check-in reporting
Data shouldn't stop at the screen. Through Check-In Reporting, the platform connects digital engagement with physical presence, helping volunteer teams and kids' ministry leads manage attendance and safety with ease.
Physical attendance tracking connects the dots between who is showing up on Sunday and how they are engaging with the church's digital resources throughout the week.
What to look for in a church engagement platform
When researching your options, consider these three pillars of high-engagement analytics:
- Visibility: Can you see your Website Traffic and App Usage in the same place you view your giving?
- Simplicity: Does the dashboard provide "at-a-glance" insights, or do you have to be a data scientist to read it?
- Mission-focus: Does the data help you reach more people with the gospel, or is it just numbers on a page?
Subsplash: The gold standard for holistic church analytics
If you are looking for the most comprehensive data suite, Subsplash is currently the top-tier competitor. After creating the very first church app in 2009, Subsplash has since helped over 20,000 churches and ministries with their digital needs, transforming digital engagement to ongoing discipleship.
And unlike traditional Church Management Software (ChMS) that treats "giving" and "media" as separate silos, Subsplash integrates them into a single "Ministry Intelligence" framework. WIth the all-in-one Subsplash platform, you can see updated analytics from church engagement from one ministry hub!
The future of ministry intelligence: Trends AI
While having access to individual reports is a significant step forward, the real breakthrough happens when those reports start talking to each other.
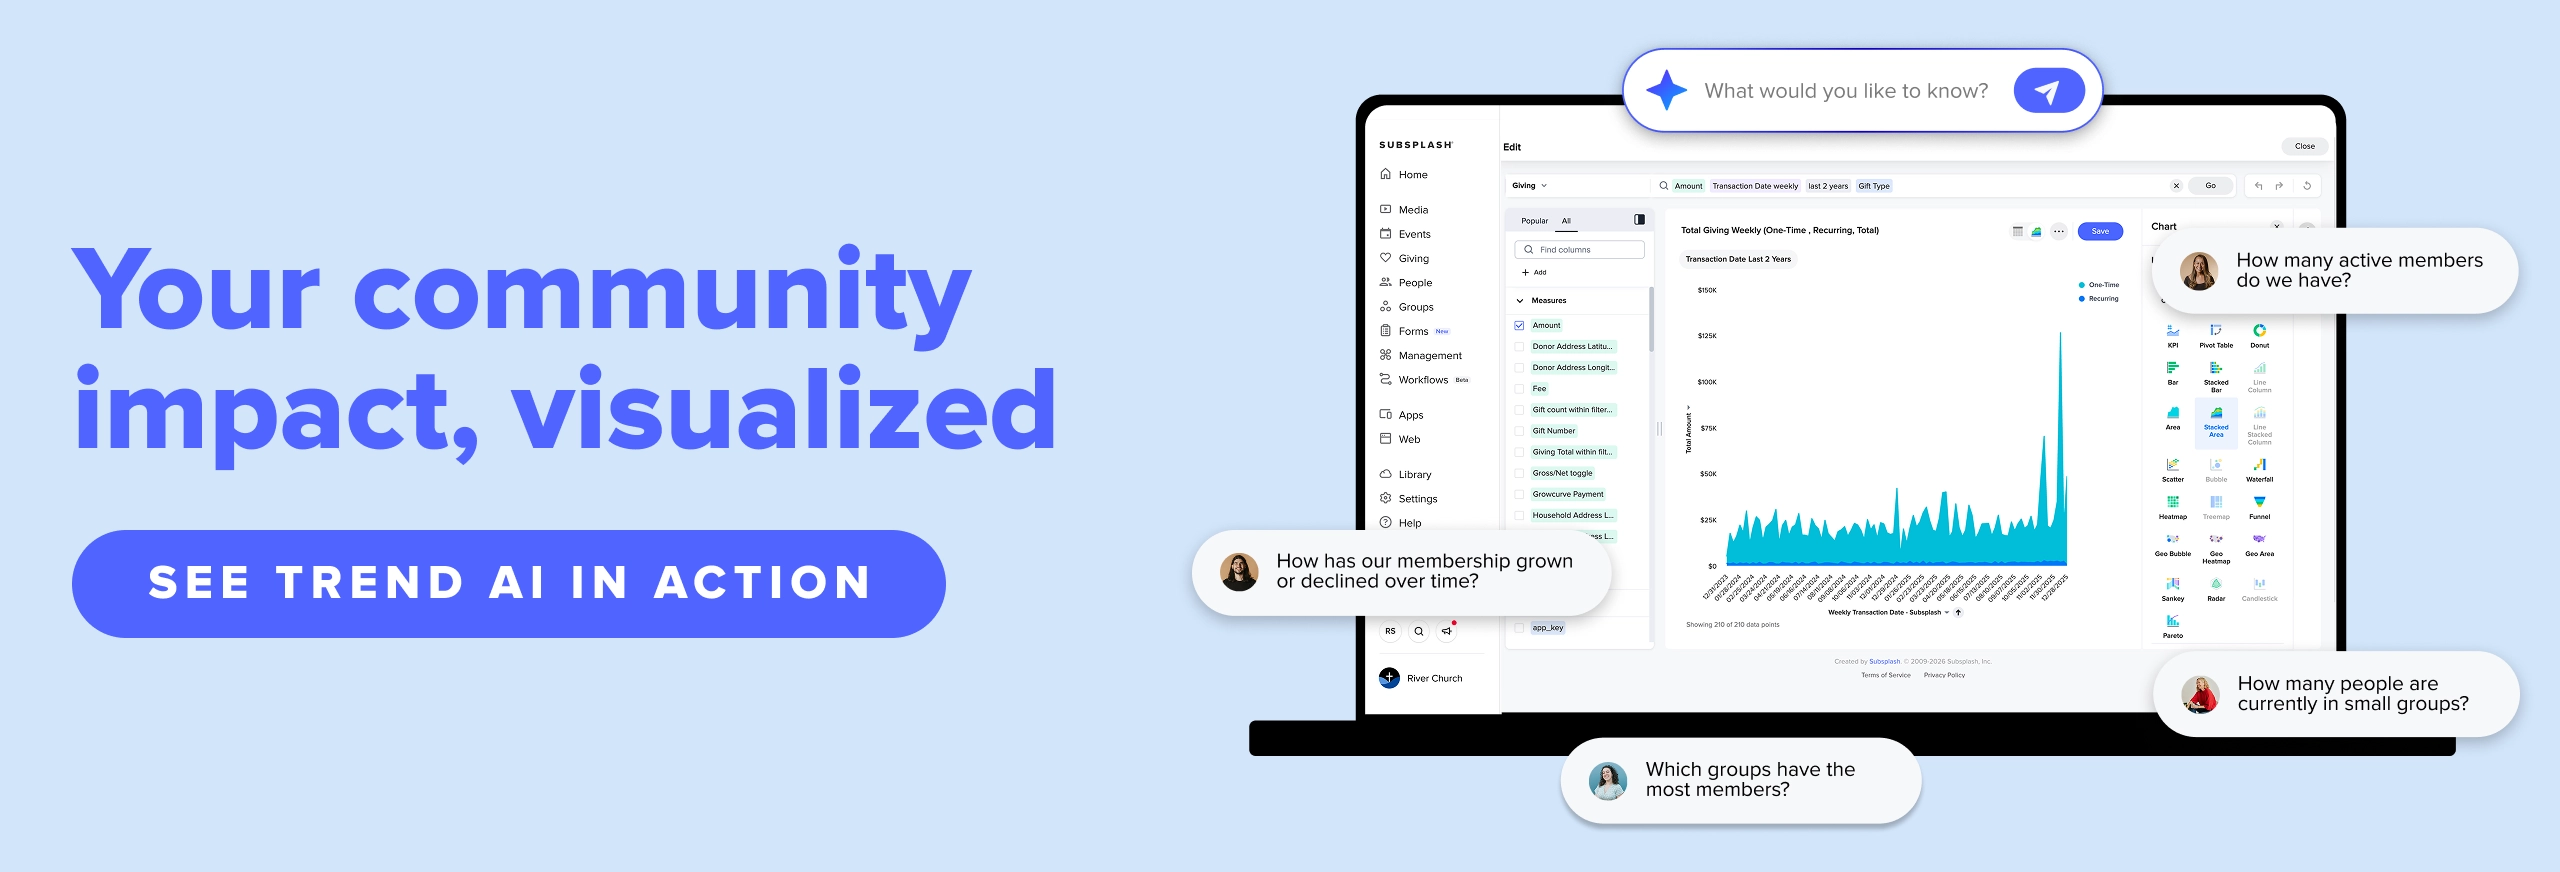
Trends AI is our latest innovation—a powerful intelligence hub that brings your fragmented people, giving, and attendance data into one clear view.
What makes this tool groundbreaking is the ability to have an actual conversation with your data from the Subsplash Platform and external sources. You don’t need to be a spreadsheet expert to get answers.
With Trends AI Analysis, you can simply ask, “Show me giving trends over the last six months,” or “Which members have stopped attending recently?”
The AI instantly generates custom visuals from over 25 different chart types, moving you from guessing to knowing exactly how your ministry is flourishing.
Take a virtual tour of Trends AI today.
If you’d like to learn how your church can benefit from using Subsplash’s unified platform, [.blog-contact-cta] let’s chat! [.blog-contact-cta]
More resources you may find helpful:
- Church leaders: 10 essential duties of a pastor
- How do integrated church platforms simplify administrative work?
- How churches reach 3X more people with Subsplash
- Top 10 challenges facing pastors
- 3 Strategic ways to use your church app to increase volunteer recruitment